U.S. Elections in Five Pictures —
Unique Backdrop, Consistent Trends
Elections can be unsettling as they create uncertainty around social and economic policies that may impact not only financial markets but also our daily lives. This year’s uncertainty is not isolated to the U.S.: Globally, more voters than ever will head to the polls, with 40% of the world’s population facing consequential elections.
At the same time, we note that while there is uncertainty around who will win the U.S. election, there is some familiarity in the governing policies of each candidate since they are currently, or have recently been, in office. Although future policy might not precisely mirror each candidate’s past, we have a useful case study for the likely policy focus of each administration.
Beyond short-term bouts of market volatility leading up to election day, we believe a shift toward easier monetary policy, alongside a still growing economy, will be the primary driver of market performance. Moreover, a divided government (our base case) likely means the most extreme policy proposals from each candidate are unlikely to materialize. That said, the economy and corporate earnings can be affected at the margin by new policies, which the investment department continually analyzes.
In this Investment Insights, we emphasize the importance of maintaining a long-term investment perspective during the election cycle, while also highlighting key aspects of the upcoming race.
Exhibit 1: Average Monthly Volatility in Election Years (VIX Index)
Key Takeaway: Historically, volatility has inched higher from August to October in election years as political uncertainty increases investor anxiety. It is possible that the outcome for the upcoming U.S. presidential election may not be known on election night given the tightness of the race. Results are expected to come down to a few swing states, which could further add to volatility, in our view. However, once the outcome of the election is known and election uncertainty subsides, history shows that volatility typically reverts to long-term averages.
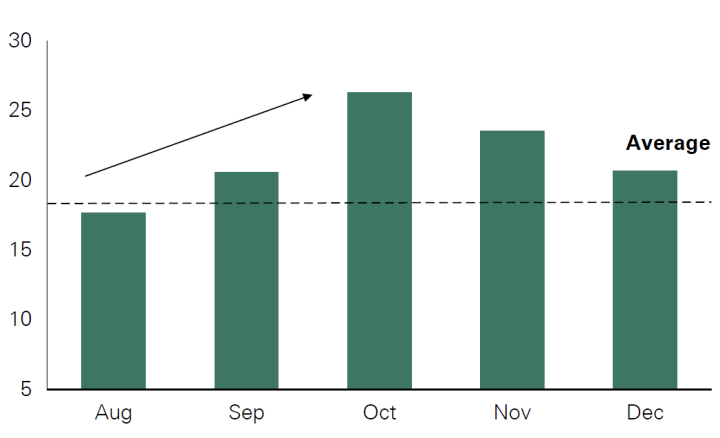
Exhibit 2: S&P 500 Election-Year vs. Average Performance
Key Takeaway: Although volatility has historically picked up ahead of elections, equity market performance has been consistent with longer-term averages. Policy can loom large in the short run, impacting certain sectors or countries; however, the stock market has proven resilient over the long term despite preelection uncertainty.
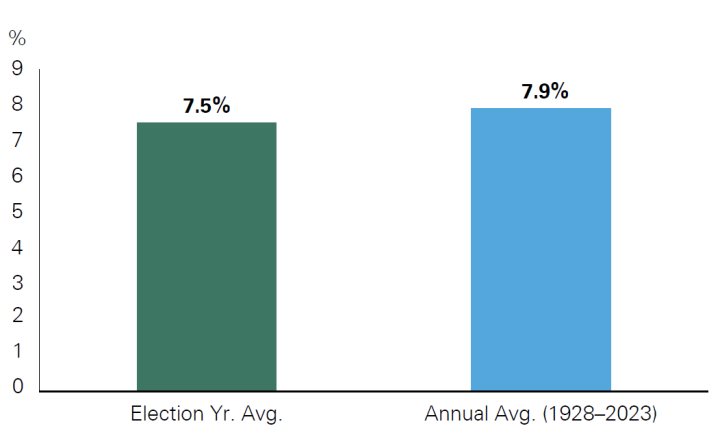
Exhibit 3: S&P 500 Returns Around Presidential Elections
Key Takeaway: On average, September has historically been the most challenging month for equity markets. This year, the U.S. election adds an additional dynamic to recurring seasonal patterns. While an increase in equity market volatility can be expected as we approach election day, historically, once the outcome is known, markets have typically reverted to focusing on longer-term company and economic fundamentals.
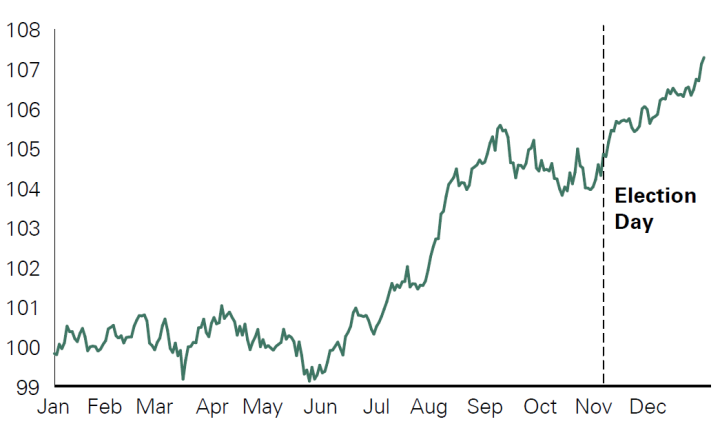
Exhibit 4: Demystifying Market Expectations — Average Returns for China and Energy by Administration
Key Takeaway: While there have historically been projections for winners and losers under each president, the economic backdrop typically drives results. Heading into this election cycle, the consensus is that traditional energy will benefit under a Trump presidency given his push for deregulation, while China could suffer given his push for additional tariffs. Interestingly, historical data has shown otherwise: The energy sector has performed better during Biden’s presidency, while China was stronger under Trump. Often, preconceived notions of market behavior relative to election outcomes prove inaccurate.
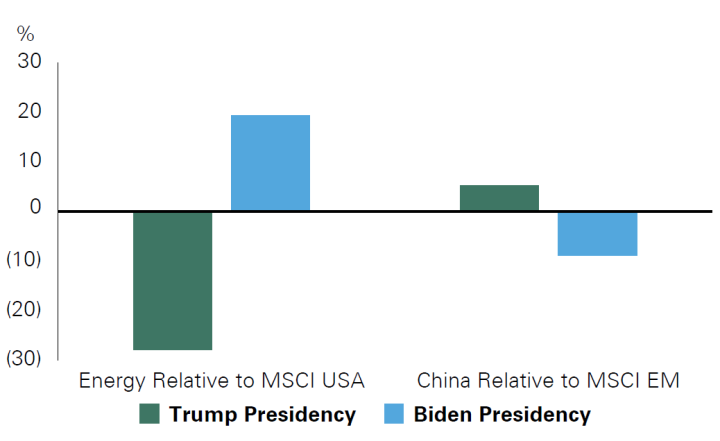
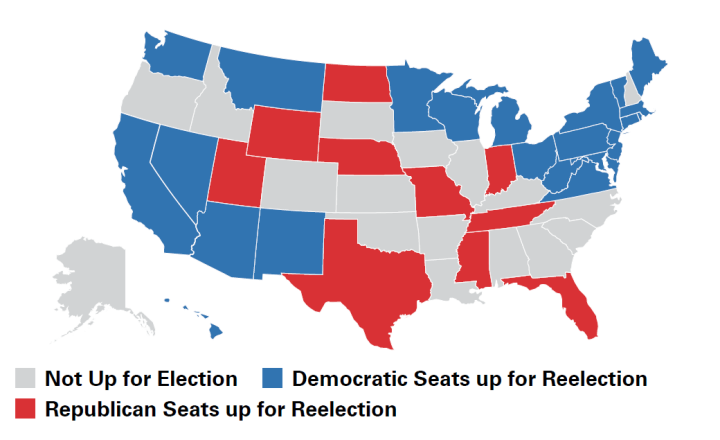
Exhibit 5: 2024 Senate Seats Up for Election
Key Takeaway: The makeup of the 100-seat Senate map favors Republicans in 2024; Republicans will continue to hold 38 seats, the Democrats will only maintain 28 seats, and the remaining 34 seats will be up for reelection. Notably, Democrats face a challenging backdrop given that 23 of the 34 seats up for election are held by their party. If Vice President Harris wins and the Senate is won by the Republicans, it will be the first time since 1884 that a Democratic president begins a presidential term without their party ruling the Senate. In the House of Representatives, Republicans currently hold a razor-thin four-seat majority and face a similar challenge to the Democrats’ Senate map. Our base case is a divided federal government, which is often a positive for equity market returns as it limits the potential for sweeping policy changes from either party.
Conclusion
Despite the uncertainty that elections bring, history demonstrates that maintaining a long-term investment approach has been additive for client portfolios. We maintain our focus on investing in high-quality companies and note that, at times, election volatility can create dislocation and, therefore, attractive entry points for companies. We encourage clients to remain invested and overlook short-term election-related volatility. We have numerous communications lined up around the election, including this recently published elections Q&A, and we encourage you to contact your advisor should you have any questions.
Past performance is no guarantee of future results. This material is provided for your general information. It does not take into account the particular investment objectives, financial situations, or needs of individual clients. This material has been prepared based on information that Bessemer Trust believes to be reliable, but Bessemer makes no representation or warranty with respect to the accuracy or completeness of such information. This presentation does not include a complete description of any portfolio mentioned herein and is not an offer to sell any securities. Investors should carefully consider the investment objectives, risks, charges, and expenses of each fund or portfolio before investing. Views expressed herein are current only as of the date indicated, and are subject to change without notice. Forecasts may not be realized due to a variety of factors, including changes in economic growth, corporate profitability, geopolitical conditions, and inflation. The mention of a particular security is not intended to represent a stock-specific or other investment recommendation, and our view of these holdings may change at any time based on stock price movements, new research conclusions, or changes in risk preference. Index information is included herein to show the general trend in the securities markets during the periods indicated and is not intended to imply that any referenced portfolio is similar to the indexes in either composition or volatility. Index returns are not an exact representation of any particular investment, as you cannot invest directly in an index.