2024 U.S. Presidential Election
and Markets Q&A
- Elections are times of political and market uncertainty and, consequently, elevated market volatility; however, election-driven volatility tends to subside quickly once the outcome is known, regardless of which party prevails.
- The U.S. economy remains resilient with more investment opportunities than any other global market, and we believe this will remain true regardless of who controls the White House and Congress in 2025.
- Bessemer maintains an overweight to U.S. equities, with an active, long-term investment philosophy that looks beyond the short-term volatility that can stem from election cycles. At the same time, however, we are maintaining an eye toward policy-related implications and resultant opportunities.
With only a handful of weeks left until the 2024 U.S. presidential election, we include our views and investment approach below, particularly given heightened political uncertainty and the likely market volatility that often accompanies presidential elections.
This particular election cycle has already seen events that, while not unprecedented in isolation, are unique in their totality, ranging from attempted assassinations to an incumbent president dropping out of the race. That said, familiar patterns are still present, allowing us to draw on history as a guide to what the potential outcomes signify for policy and markets. Below, we detail responses to common questions that we believe are most important to understanding how this election might impact financial markets.
Question: Do elections matter to markets in the long run?
Answer: Election-related volatility matters to markets in the short term; however, in the longer term, market returns are driven by corporate earnings and economic growth, which can be affected at the margin by policy enacted as a result of elections.
Bessemer’s approach to investing is focused on the long term. We view shorter-term fluctuations in federal government control as important but secondary to corporate earnings and economic growth, the primary factors that drive market returns. In the short term, elections can produce heightened market volatility as the outcome is yet to be known. Markets often dislike uncertainty; however, once the outcome is resolved, election-related volatility tends to subside, and markets return to focusing more on core drivers of performance. Below, we depict the average monthly change in volatility in election and non-election years (Exhibit 1). There is an observable uptick in election-year volatility that subsides after the election outcome is determined.
Exhibit 1: Monthly Change in S&P 500 Implied Volatility Around Election Time
Key takeaway: An uptick in implied market volatility is present around elections versus non-election years; However, this volatility tends to quickly subside following election outcomes.
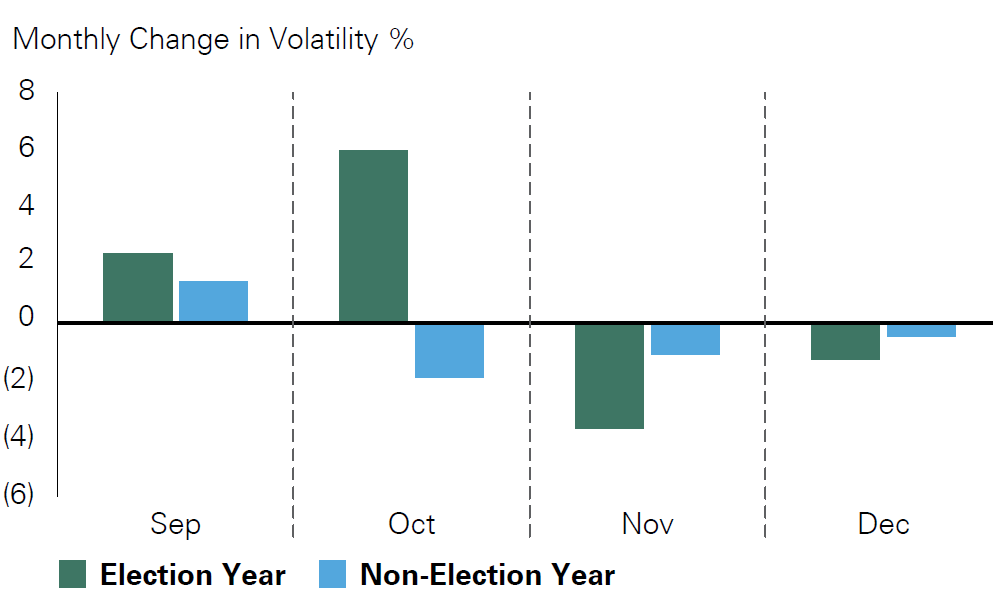
Exhibit 1: Monthly Change in S&P 500 Implied Volatility Around Election Time
Key Takeaway: An uptick in implied market volatility is present around elections versus non-election years; However, this volatility tends to quickly subside following election outcomes.
An uptick in implied market volatility is present around elections versus non-election years; However, this volatility tends to quickly subside following election outcomes.
Source: Bloomberg
Election-related volatility can come in many forms. It is not uncommon to see the performance of certain sectors correlate to a presidential candidate’s polling if there are proposed policies that could materially impact certain businesses. For example, we often see financials trading more positively when former President Trump has a polling edge given Republican focus on deregulation, and green energy trading positively when Vice President Harris is in the lead given Democratic focus on renewable energy.
Longer term, policies passed by Congress and signed into law by the president may provide multiyear headwinds or tailwinds to select sectors of the economy. We remain vigilant in assessing any new policy proposals put forth by either party and their potential effects on individual companies or sectors. Policy changes can often provide opportunities for investment in new companies or reaffirm conviction in existing investments, a research practice in which our equity teams are constantly engaged.
We ultimately view policy as secondary to the fundamental attributes of the U.S. economy that make it an investable market: a focus on shareholder value, private property rights, free and open markets, and the rule of law. Bessemer retains an overweight position to the U.S. versus relevant benchmarks in part due to these critical attributes that allow for an environment where the highest quality global companies are domiciled. The Bessemer investment team will be releasing further analysis on potential policies of the new administration after the election.
Question: How do markets usually perform around and after an election?
Answer: History has shown that returns are often — but not always — positive both in election years as well as in the weeks and months following an electoral outcome, regardless of the balance of power in Washington. We encourage investors to focus on the long term and look past short-term election-related volatility.
Equity markets often enjoy a sustained period of relief following a presidential election, regardless of which party wins the White House. In the chart below, going back to 1984, we examine post-election performance, which is split evenly between five Republican and five Democratic victories (Exhibit 2). We find, on average, that the S&P 500 posts a positive return of approximately 20% in the year that follows an election. While we don’t assume the current election cycle will follow the same pattern, based on market history, we would also caution against moving away from risk assets heading into an election.
Exhibit 2: Average Growth of $100 Over the Year Following Election Day Since 1984
Key takeaway: Markets have historically appreciated following an election, returning approximately 5% in the subsequent 100 days on average, and 20% a year later, on average, regardless of which party won the election.
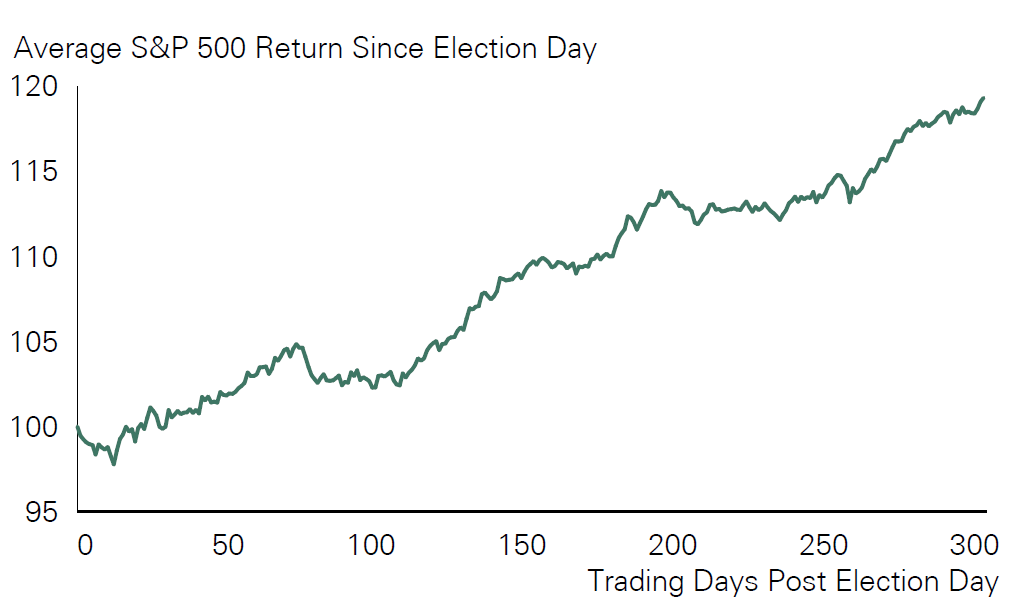
Exhibit 2: Average Growth of $100 Over the Year Following Election Day Since 1984
Markets have historically appreciated following an election, returning approximately 5% in the subsequent 100 days on average, and 20% a year later, on average, regardless of which party won the election.
Source: Bessemer Trust, FactSet
Question: What data is the Bessemer investment team monitoring to gain insights on the election?
Answer: We monitor a diverse set of data ranging from economic indicators to state and national polls when forming a view of who may control the White House and Congress in 2025.
While we cannot say who will be the 47th U.S. president, we do know that the outcome is likely to be close, decided across seven “swing states” and by self-identified independent voters that make up only a small portion of the electorate. In such closely divided partisan times, we believe it’s possible that the election will be close enough that we will not know who the victor is on election night and perhaps not even until later that week. Our base case is that the election is a toss-up, as various indicators point in favor of former President Trump while others point to Vice President Harris. We cover two distinct and important indicators below.
Beginning with economic data, the “Misery Index” is the sum of the current inflation rate and unemployment rate and has correctly predicted 15 of the last 16 elections, according to Strategas Research. Given the inputs, it has proven to be a critical gauge for the direction of overall consumer and voter sentiment. In an economy with higher year-over-year inflation and unemployment, voters will be more apt to punish the incumbent party as their spending becomes constrained. The latest reading still exhibits a year-over-year reading that would give an edge to Harris. However, if either the unemployment rate or inflation were to reaccelerate in October, it could spell trouble for the vice president as this gauge is close to breaching a threshold that would indicate a loss for the incumbent party in November.
Our second critical indicator is polling data. Currently, polling suggests a tight race, with former President Trump having a slight edge in betting markets, though his lead has narrowed compared to a few months ago, when his opponent was President Biden. While many polls indicate Vice President Harris has a slight lead, we must consider the polling errors from the last two presidential elections. Nationally, Trump outperformed polls in 2020 by a wider margin than in 2016, raising questions about polling relevance. That said, we believe that polling data should not be disregarded entirely as many of the polls in 2016 and 2020 still predicted the actual result within their respective stated margins of error. Additionally, polling methods and data collection have diversified, with the number of active national polling organizations more than doubling since 2000, according to Pew Research.
Taking the above factors into account, we still aim to examine polling data through the lens of what has transpired in the prior two presidential elections, where former President Trump was a candidate. Included below is a table that depicts the 2016 and 2020 presidential election polling errors versus the final outcomes both nationally and in the seven key swing states mentioned above. What we find is that when we apply the polling error present in 2016 and 2020 to today’s polling data, Trump would still be on track for victory in November as his prior margin of error in key swing states would erase Harris’ lead if applied to polling averages in the same swing states today (Exhibit 3).
Exhibit 3: Current 2024 Polling Versus Final Polling Error in 2016 and 2020
Key takeaway: Polling error in 2016 and 2020 has been wider with Trump on the ballot than for presidential elections without Trump at the top of the ticket. Applying past polling error to current polling would give Trump the advantage.
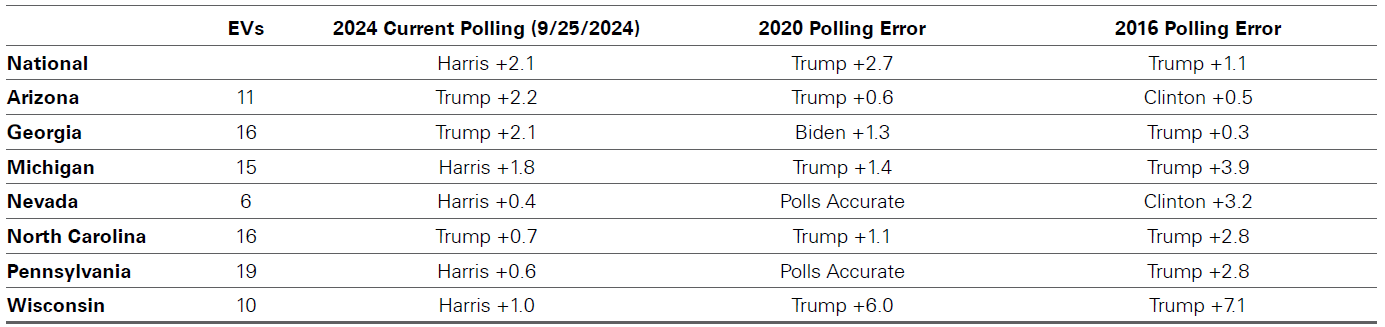
Exhibit 3: Current 2024 Polling Versus Final Polling Error in 2016 and 2020
Polling error in 2016 and 2020 has been wider with Trump on the ballot than for presidential elections without Trump at the top of the ticket. Applying past polling error to current polling would give Trump the advantage.
Source: Realclearpolitics.com
However, we still exercise caution in extrapolating too much here as there is the distinct possibility that pollsters have sufficiently adjusted their methodologies since 2020 to more accurately capture the Trump polling error that was present in the prior two presidential election cycles. We view polling data as an important directional indicator, but still prone to flaws.
Question: What is Bessemer’s outlook for who will control Congress? What is the likelihood that one party will control both the White House and Congress next year?
Answer: Our base case is a divided federal government, which is often positive for equity market returns as sweeping policy changes from either party become unlikely (Exhibit 4).
With so much media attention often focused on the top of the ticket, it can sometimes be easy to forget that presidential elections also include elections for all 435 seats in the House of Representatives as well as one-third of the 100-member Senate. With that in mind, it is worth reviewing what the likely outcomes are for Congress given that it will determine how legislatively ambitious the next president can afford to be.
In the Senate, party composition is currently divided almost evenly with the Democrats holding a one-seat majority. Democrats’ ability to retain control of the Senate in 2025 is going to be challenged by a difficult electoral map as they are defending seats in West Virginia, Ohio, and Montana, three states that voted for former President Trump in 2016 and 2020 by wide margins.
In the House of Representatives, Republicans currently hold a razor-thin four-seat majority and face a similar challenge to the Democrats’ Senate map. The GOP will be defending 19 seats in districts that President Biden won in 2020, versus eight seats held by Democrats in districts won by Trump in 2020, according to Ballotpedia. Given the fact pattern above, absent a large blue wave or red wave, a divided federal government remains the most likely outcome, in our view. We specifically view a blue wave as the least likely outcome given that the senate map is more challenging for Democrats than the Republican House of Representatives map is this cycle.
Exhibit 4: Median Historic S&P 500 Performance Under Various Partisan Combinations
Key takeaway: Markets have experienced the best performance during periods of divided government.
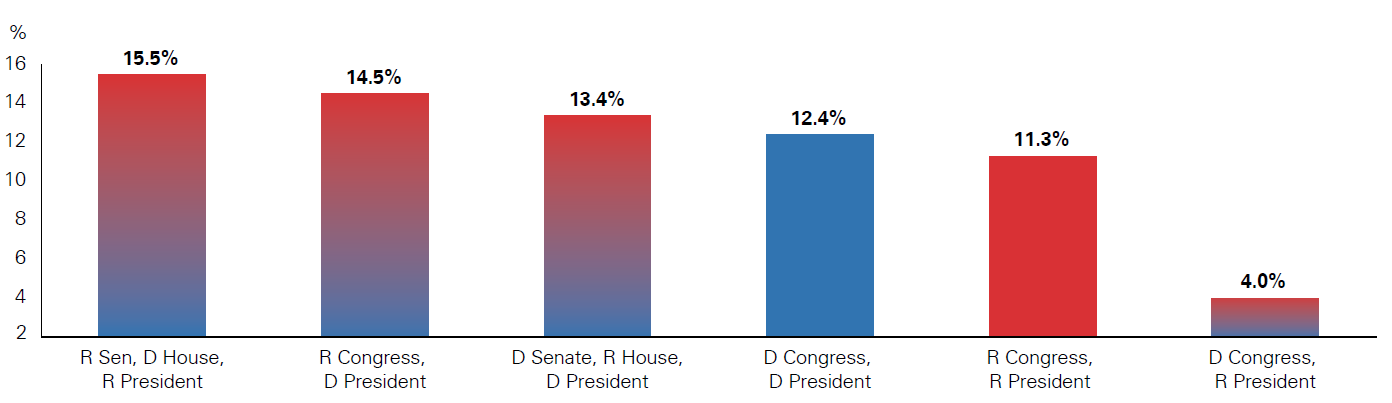
Exhibit 4: Median Historic S&P 500 Performance Under Various Partisan Combinations
Key Takeaway: Markets have experienced the best performance during periods of divided government.
Source: Bessemer Trust, Strategas
Question: What are the policy implications of a divided government versus one-party control?
Answer: A White House and Congress controlled by the same party will have more ability to pass legislation affecting various policies versus divided government.
Regardless of the composition of congressional and White House control, we know with certainty that the incoming president and the 119th Congress will have much to focus on, particularly with regard to foreign, fiscal, and tax policy. While there is still some uncertainty surrounding details for each candidate’s policies, we outline below what we anticipate being the likely approach of each candidate on key issues facing the next administration (Exhibit 5). If both the White House and Congress are controlled by one party, it would permit an environment in which more of each candidate’s policies could be implemented. However, we anticipate a divided federal government being the most likely election outcome, which would constrain each candidate from implementing any sweeping partisan policy changes.
Exhibit 5: Select Policy Positions of Both Presidential Candidates
Key takeaway: Both former President Trump and Vice President Harris hold key policy differences on various issues. The table below illustrates differences each candidate holds on major issues that could affect markets and certain sectors.
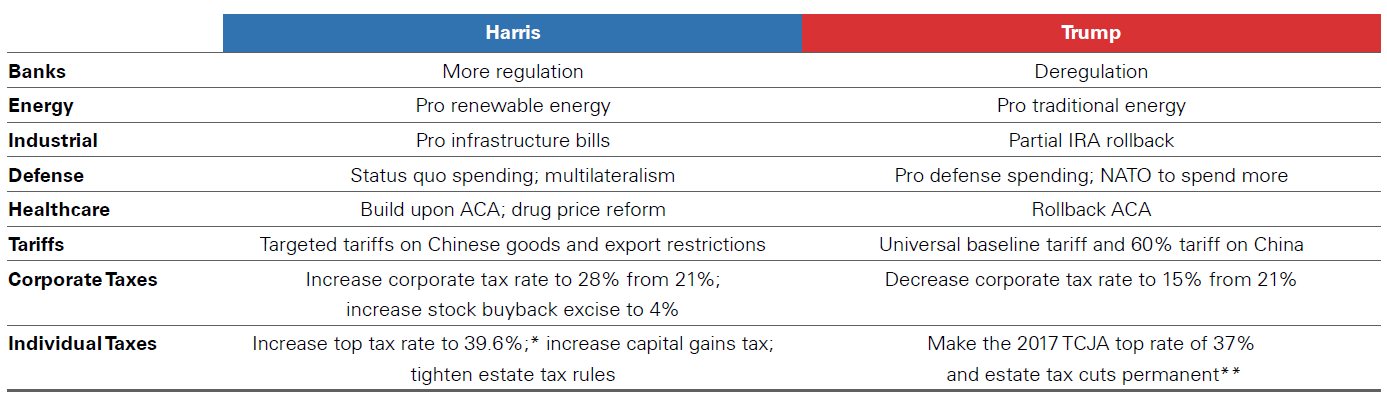
Exhibit 5: Select Policy Positions of Both Presidential Candidates
Key Takeaway: Both former President Trump and Vice President Harris hold key policy differences on various issues. The table below illustrates differences each candidate holds on major issues that could affect markets and certain sectors.
** Trump has suggested replacing personal income taxes with increased tariffs. Source: Bessemer Trust
Question: How likely is tax policy to change in 2025? Is there anything I should be doing now to prepare for potential changes?
Answer: We anticipate changes to the tax code in 2025 as certain pieces of the 2017 Tax Cuts and Jobs Act (TCJA) are set to expire. What happens with tax policy is dependent on the outcome of the election.
Our base case is for divided government, however, and we therefore envision gridlock or a compromise on tax policy, dramatically reducing the likelihood of extreme policy outcomes.
Key pieces of the TCJA, such as the state and local tax (SALT) deduction cap of $10,000, are set to expire at the end of 2025. If the SALT deduction cap is not extended, it would benefit taxpayers in higher-tax states with significant personal real estate holdings. In addition, the top income tax bracket would also increase from 37% to 39.6%. On the corporate side, there would be no changes absent new legislation as the portions of TCJA affecting the corporate rate were made permanent, unlike the components affecting the individual taxpayer structure. However, the corporate tax rate could still be subject to change in a blue wave scenario. In a divided government, the corporate tax rate could also be used as a bargaining chip in broader tax policy negotiations due to the expiration of certain pieces of the TCJA.
Given the tax policy uncertainty, Bessemer recommends being proactive with estate planning before 2026, when the estate tax exemption will also expire with no certainty that it will be extended. We recommend clients speak with their tax attorneys and accountants to determine the best path forward as each individual taxpayer’s circumstance are different. The Bessemer tax department will be publishing further analysis on this in the coming weeks and months as potential tax policy outcomes become clearer.
Question: I am concerned about the outcome of the election. Is the Bessemer investment team making any changes to client portfolios in anticipation of the election?
Answer: As we draw closer to election day, investors and voters alike are often inundated with information that is designed to elicit an emotional response. While it may be tempting to make significant portfolio changes ahead of a political event, market history has demonstrated that attempting to time or trade the outcome of an election can often produce costly results.
Periods of market volatility absent a macroeconomic deterioration, whether associated with an election or not, may provide opportunities for our equity teams to add further to positions in quality companies that may be experiencing dislocation. We actively monitor markets for these opportunities. While we limit speculation on sectors, industries, or individual companies based on an election outlook, we intend to ensure that our portfolio positioning is balanced and insulated from either outcome. Certain sectors or companies may trade at attractive prices depending on the policy proposals put forth by the candidate leading in the polls at any one time. In those instances, our equity teams will look to add to positions in quality companies at attractive prices. For example, financial companies often tend to exhibit a positive correlation with former President Trump’s polling odds due to possible regulatory rollbacks; however, Bessemer portfolio holdings in the sector would be driven by the companies’ earnings potential, competitive advantages, and the current economic environment.
Looking at longer-term changes, once an election has passed and actual policy is implemented, we can often make more adjustments. The Bessemer investment team will be releasing further detailed analysis on potential policies of the new administration following the outcome of the election.
Concluding Thoughts
Bessemer believes in a long-term approach to investing. While elections can often be a time of heightened uncertainty and national anxiety, history shows us that staying the course produces the best results for client portfolios. We aim to invest in high quality companies at attractive prices, regardless of electoral outcomes. We encourage clients to stay invested and look past short-term election-related volatility.
Past performance is no guarantee of future results. This material is provided for your general information. It does not take into account the particular investment objectives, financial situations, or needs of individual clients. This material has been prepared based on information that Bessemer Trust believes to be reliable, but Bessemer makes no representation or warranty with respect to the accuracy or completeness of such information. This presentation does not include a complete description of any portfolio mentioned herein and is not an offer to sell any securities. Investors should carefully consider the investment objectives, risks, charges, and expenses of each fund or portfolio before investing. Views expressed herein are current only as of the date indicated, and are subject to change without notice. Forecasts may not be realized due to a variety of factors, including changes in economic growth, corporate profitability, geopolitical conditions, and inflation. The mention of a particular security is not intended to represent a stock-specific or other investment recommendation, and our view of these holdings may change at any time based on stock price movements, new research conclusions, or changes in risk preference. Index information is included herein to show the general trend in the securities markets during the periods indicated and is not intended to imply that any referenced portfolio is similar to the indexes in either composition or volatility. Index returns are not an exact representation of any particular investment, as you cannot invest directly in an index.