U.S. Dollar and Debt Ceiling in Focus
- The U.S. dollar is in focus given a possible end to the Fed’s hiking cycle, banking stress, and an approaching deadline to raise the debt ceiling.
- An important attribute of the U.S. dollar is that it is the invoicing currency of the world, meaning most global trade transactions are at least partially converted into U.S. dollars.
- In consideration of current currency risks, particularly against portfolio benchmarks, we have adjusted exposure to the U.S. dollar at the margin.
- The probability of a U.S. government default is extremely low, but we believe the path to resolution will be contentious and accompanied by market volatility.
Despite a challenging macroeconomic environment, stocks and bonds have posted gains this year. The Federal Reserve's signaling a possible end to its hiking cycle, alongside a looming deadline to raise the debt ceiling, has brought the U.S. dollar into greater focus. U.S. monetary policy has reached a dovish inflection point amid an economic backdrop of slower growth and tighter lending standards in the banking system. As non-U.S central banks have hiked interest rates and U.S. economic data have weakened, the strength of the U.S. dollar has softened relative to last year but remains strong by historical standards. A pause in the Fed’s hiking cycle combined with the potential for a U.S. default could place downward pressure on the U.S. dollar.
The debt ceiling and potential default have come into greater focus — a scenario that poses risk to the U.S. dollar and global financial markets. Since 1960, the debt ceiling has been lifted 78 times, and while we do feel this time will follow suit, the debate is likely to be contentious and could come down to the final hour, causing increased market volatility. The credit quality of the U.S. is once again in the spotlight as the 2011 debt ceiling debate led to a U.S. credit rating downgrade.
The Strong U.S. Dollar
The U.S. dollar has experienced a historic rally since the doldrums of the pandemic. From a broad, trade-weighted perspective, it appreciated by over 15% from the beginning of 2021 to the fourth quarter of 2022. Versus specific currencies, the dollar appreciated by nearly 20% against the euro and 43% against the yen in the same period. These currency fluctuations have real economic and financial market ramifications. For example, a stronger dollar makes U.S. exports less attractive and decreases the dollar value of foreign revenues of U.S.-domiciled companies as they are converted back to U.S. dollars. With this impact in mind, we’ve analyzed the current foreign-exchange backdrop and possible portfolio risks in the quarters and years ahead.
In the early 1980s, policy implemented by the Reagan administration, combined with the monetary policy of a Volcker-led Federal Reserve, created an environment for significant U.S. dollar strength. More specifically, the administration drove aggressive fiscal stimulus while the Federal Reserve was fighting an inflation storm with interest-rate hikes as a key tool. Subsequently, in 1985, extreme dollar strength was met with the Plaza Accord. The Plaza Accord was an agreement to intervene in the currency markets to help depreciate the dollar, and a groundswell of support came from U.S. industries campaigning for protection against foreign competition.
Fast forward to the 2020s, and we again have an economic makeup of heightened fiscal spending along with tighter monetary policy. In the summer of 2022, there was speculation of another Plaza-type accord to counter the dollar’s appreciation. From both a nominal perspective and through a real-effective-exchange-rate lens (which adjusts for inflation), the dollar is very strong — the strongest it’s been since the Plaza Accord (Exhibit 1).
Exhibit 1: The U.S. Dollar Is Strong on Two Key Measures
Key takeaway: In real terms, the dollar has reached its highest level since 1985; in nominal terms, dollar strength has reached levels not seen in years past.

Dual line graphs charting the U.S. dollar’s strength over decades: one for the real effective exchange rate and one for the nominal effective exchange rate, highlighting historical peaks and recent trends in dollar appreciation relative to other currencies.
Source: JPMorgan Research
There are reverberations from currency moves that impact growth, inflation, corporate revenues, and more. With these implications in mind, we examine factors that may drive the U.S. dollar in the year(s) to come.
A multitude of factors drive currency moves. The most impactful driver is the differential of interest rates between two countries. The higher the real interest rate relative to those in other countries, the more attractive the currency or assets denominated in that currency. Generally, higher interest rates, particularly in developed-market countries, correlate with stronger growth as central banks try to control inflation. There is some truth to the adage that a strong currency is a symbol of a strong economy (Exhibit 2).
Exhibit 2: 3-Month Deposit Rate
Key takeaway: Interest rate differentials between countries drive currency moves.

A bar chart illustrating 3-month deposit interest rates for the U.S. dollar, euro, British pound, and Japanese yen as of April 30 2023, showing the dollar’s rate highest among the group and the yen’s rate slightly negative.
Source: Bloomberg
The pronounced shift by the Federal Reserve to raise rates in 2022 provided this tailwind to the dollar, not because the U.S. was so strong, but rather because inflation was impacting price stability.
As mentioned before, there are other factors that impact currency valuations, but one that stands out as we analyze the data is asymmetry in the balance of payments between countries — namely with China and oil exporting countries like Saudi Arabia. An important attribute of the U.S. dollar is that it is the “invoicing” currency of the world, meaning most global trade transactions are at least partially converted into U.S. dollars. This is why supplanting the dollar as the global reserve currency is such a tall task.
Meanwhile, China, the world’s largest exporter, is experiencing its highest exports on record, with further ramifications for the dollar. This is partly the result of the massive amount of goods consumption during the height of the COVID pandemic, and nearly $3.6 trillion has flowed into China as a result of these exports (Exhibit 3).
Exhibit 3: China Exports vs. Imports and China Yearly Cumulative Trade Surplus
Key takeaway: As companies have become reliant on China for manufacturing, paired with goods consumption that soared during pandemic, demand for goods out of China is elevated, resulting in a trade surplus.

Dual line charts showing China’s exports versus imports over time and China’s yearly cumulative trade surplus, indicating trend growth in export volumes and widening trade surplus that influences global currency dynamics.
Source: SAFE – China’s State Administration of Foreign Exchange
On the other side of the equation, China’s zero-COVID policy has trapped money received from exports within the country. Many emerging market countries implement a surrender requirement of foreign capital received. They require the exporters to convert their revenues back into the domestic currency. Over a decade ago, China abolished the surrender requirement in an effort to liberalize its currency. Exporters then had the freedom to convert some or none of their revenues. Backing into this conversion rate, we find that exporters are holding a significant amount of dollars, approximately $1.5 trillion (see Exhibit 4 below).
Exhibit 4: China’s Trade Balance and Potential Dollar Build-Up
Key takeaway: When exporters hold dollars, it can amplify currency fluctuations; this likely intensified the dollar appreciation seen in 2022 but can also contribute to vulnerability of the dollar going forward.
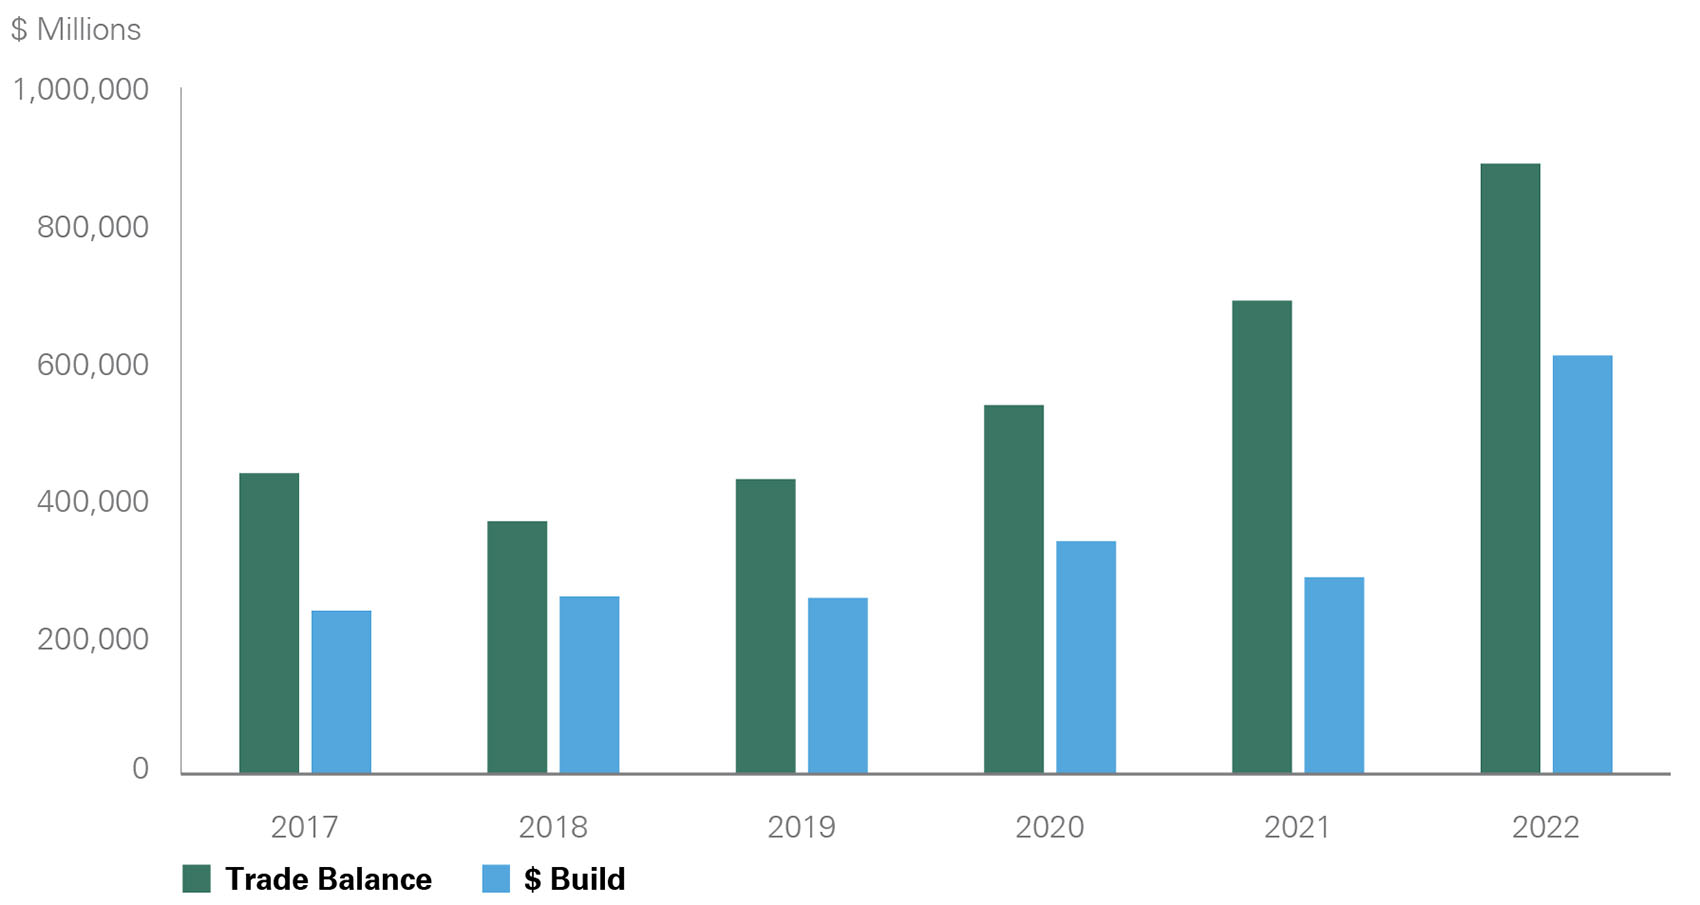
A multi-year bar chart illustrating China’s annual trade balance alongside China’s potential buildup of U.S. dollar reserves from 2017 through 2022, highlighting a steady increase in both measures and suggesting how sustained trade surpluses may influence dollar flows and global currency dynamics.
Source: SAFE – China’s State Administration of Foreign Exchange
This phenomenon has supported the dollar on the way up and can also exacerbate its depreciation on the way down.
In the mid-2000s, petrodollar recycling impacted currency markets. Petrodollar recycling is when oil exporting countries sell a portion of their U.S. dollar proceeds from oil sales (invoiced in dollars) to diversify their reserve holdings. With Brent oil prices trading at a price as high as $120 per barrel, oil exporters had a significant amount of cash flow to manage. According to the International Energy Association (IEA), global oil and gas profits rose from an average $1.5 trillion in recent years to $4.0 trillion in 2022. However, these flows did not seem to recycle back into the market. Perhaps the sovereign wealth funds of the respective countries parked these cash flows in dollar-denominated assets such as short-term fixed income (remember the interest-rate differential factor).
The following scenario is an example of the reflexive power of dollar appreciation: A French household sells its euros to purchase U.S. dollars in order to buy an expensive barrel of oil from a Saudi Arabian exporter that does not resell a portion of those proceeds. Instead, Saudi Arabia’s sovereign wealth fund invests the dollar-denominated assets. These locked-up petrodollars can have a similar impact on the dollar as do the trapped reserves in China.
The implications of currency stability are important as they have obvious economic effects on growth and inflation. A freely floating stable currency is important for a properly functioning credit system. From a financial market perspective, we examine potential flows in and out of fixed income assets and equities. We analyze our portfolio positioning relative to benchmarks and the potential currency risks. A calmer Federal Reserve and a log jam in Congress, combined with a strong dollar and plenty of reserves to potentially be sold, skew the risks for the U.S. dollar to the downside.
Considering these currency risks, particularly against respective benchmarks, we’ve adjusted portfolio positioning at the margin. In the fourth quarter, the team sold dollars via a basket of G10 currencies via forward contracts. Internally managed equity portfolios, which generally have a U.S.-centric exposure, adjusted positions to marginally add global exposure. Additionally, a weaker dollar benefits U.S. multinational companies when converting their revenue back to U.S. dollars. The team still feels confident in an overweight position to the U.S. given the preponderance of high quality U.S. companies.
Monitoring the Debt Ceiling Debate
The current backdrop of rising interest rates, a divided government with razor-thin majorities, and elevated debt levels presents a more challenging environment for raising the debt ceiling than in prior years. As the deadline to raise the debt ceiling approaches and a resolution remains an open question, debt ceiling dynamics have the potential to weigh on the U.S. dollar. In our view, the probability of a U.S. government default is extremely low, but the path to resolution will be contentious and accompanied by market volatility.
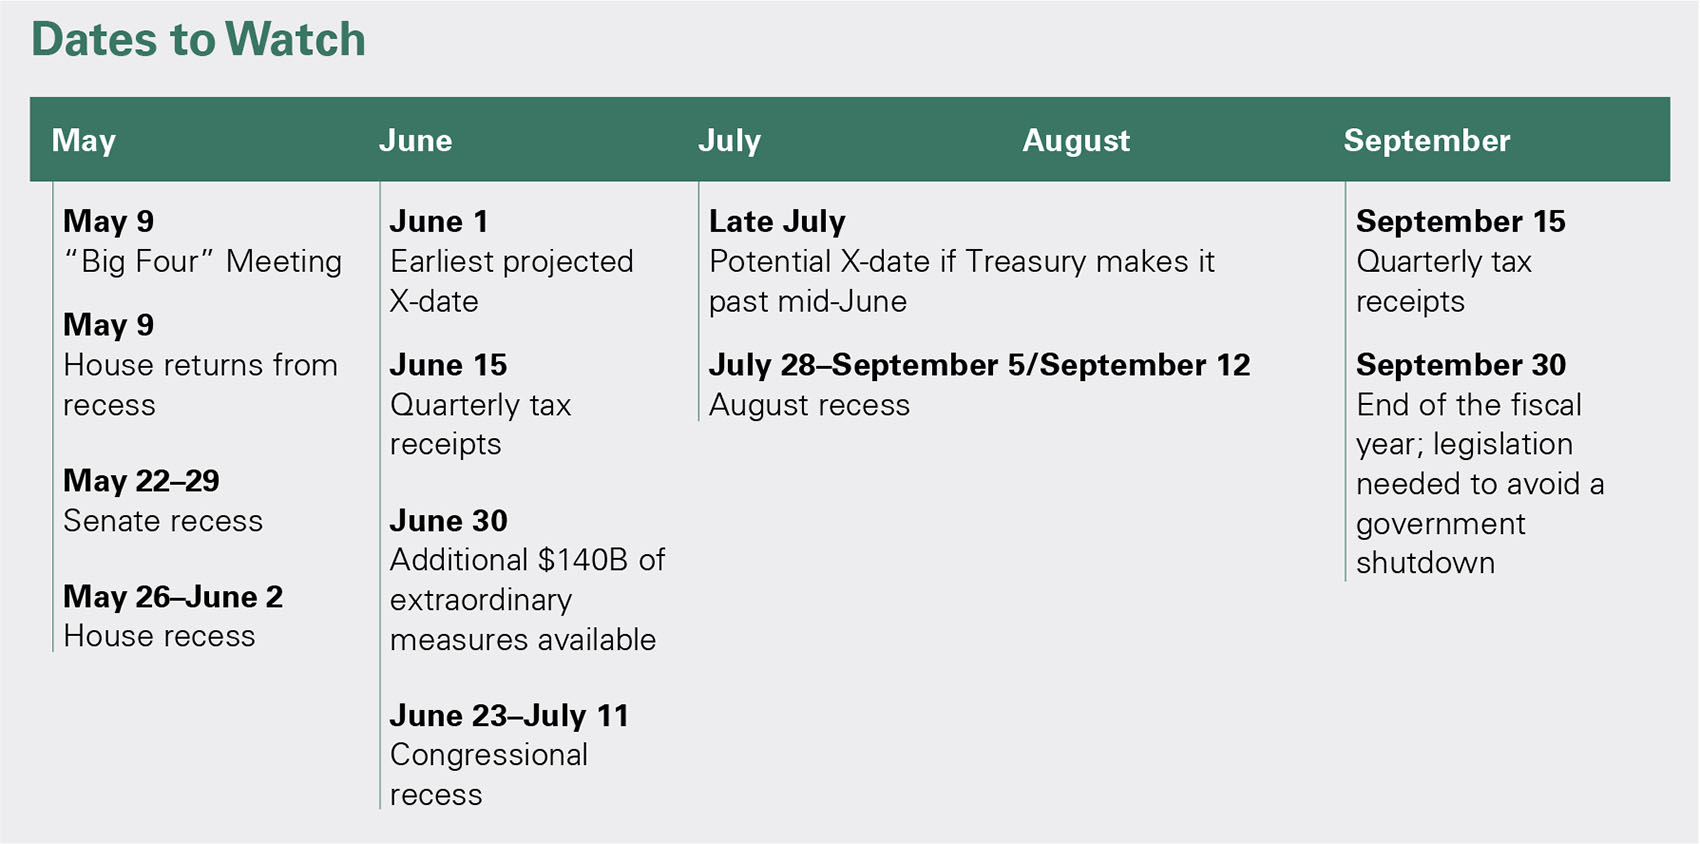
Investors have been focused on the X-date, or when the U.S. Treasury is expected to run out of the cash required to meet its obligations. After weaker-than-expected tax receipts in April, the CBO announced that the government could be unable to meet its obligations by early June. In conjunction, Treasury Secretary Janet Yellen sent a letter to Congress indicating that the X-date could be as early as June 1 but could also fall several weeks later. If the Treasury is able to make it to mid-June, additional funding from corporate tax payments and additional extraordinary measures at month end could bridge the gap until late July; however, this outcome now appears less likely. It is important to remember that the X-date is a moving target; federal receipts and outlays are variable and susceptible to change. The June 1 date incorporates some discretion regarding the Treasury’s cash cushion, an amount that is not disclosed, and therefore it is not guaranteed that the U.S. will default on this day if the debt ceiling is not raised.
With an early-June X-date, Congress is now faced with a tight timeline to raise the debt ceiling given the limited number of days Congress is in session in the month of May (see Dates to Watch below). The reduced time for negotiation raises the probability of one or more short-term extensions that could align with either the end of the fiscal year in September or year-end Omnibus in December. Additional solutions, such as the Discharge Petition, which required months for implementation, have now been ruled out. If the debt ceiling is not raised, the government will be unable to pay its obligations in full, which would result in a delay of payments or default on its obligations.
While both Republicans and Democrats agree that it is necessary to increase the debt ceiling, the parties are at odds regarding the inclusion of spending cuts. After the House Republicans were able to pass a debt ceiling resolution that included spending cuts in exchange for a one-year debt ceiling increase, it is unlikely that House Republicans will agree to pass a debt ceiling increase without cuts. While President Biden would prefer a clean debt ceiling increase, an outcome without spending cuts is more challenging in a backdrop of government expenditures trending well above historical averages.
In response to the updated CBO projections, Biden called a meeting with “The Big Four,” McCarthy, Schumer, McConnell, and Jeffries, on May 9 to discuss the severity of the situation, an encouraging sign that discussions will occur for the first time since February. Biden expressed that he would be willing to discuss government spending with McCarthy, but spending cuts should not be combined with a vote to raise the debt ceiling. However, Republicans have been stern in their inclusion of spending cuts. In our view, the fear of economic and political fallout resulting from default is likely to force a resolution, especially considering both Republicans and Democrats appear to have political motivation ahead of an election year.
In the unprecedented scenario of a U.S. default, the extent of the damage to the U.S. economy is highly uncertain, yet the impact is likely to be minimized by an imminent policy response. We could see a prioritization of payments or possibly a move by President Biden to unilaterally raise the debt ceiling under the 14th Amendment, an action that would likely be challenged in the courts. In a U.S. default scenario, we would expect a negative equity market reaction, similar to the market volatility seen around the 2011 debt ceiling crisis. However, it is important to note that in 2011 investors bought Treasuries in a flight to safety and the U.S. dollar rose. We are reassured that the 2011 debt ceiling crisis prompted the Treasury to draw up contingency plans to avoid a default on Treasury security obligations, and we fully expect that default scenario plans have been recently reviewed by both the Treasury and the Federal Reserve in light of the current situation.
Currently, stress is building in pockets of the bond market, and T-bill yields with maturities before June are trading rich relative to longer-term bills as the very front of the curve is seen as safe from debt ceiling volatility. Out of an abundance of caution, Bessemer has avoided purchases of T-bills maturing between early June and September of this year. Additionally, Bessemer money market funds hold diverse maturities, so a payment delay on a single or several positions would have little impact. Negotiations between parties will be difficult and the market will be subject to headline risk until a resolution is reached.
Past performance is no guarantee of future results. This material is provided for your general information. It does not take into account the particular investment objectives, financial situations, or needs of individual clients. This material has been prepared based on information that Bessemer Trust believes to be reliable, but Bessemer makes no representation or warranty with respect to the accuracy or completeness of such information. This presentation does not include a complete description of any portfolio mentioned herein and is not an offer to sell any securities. Investors should carefully consider the investment objectives, risks, charges, and expenses of each fund or portfolio before investing. Views expressed herein are current only as of the date indicated, and are subject to change without notice. Forecasts may not be realized due to a variety of factors, including changes in economic growth, corporate profitability, geopolitical conditions, and inflation. The mention of a particular security is not intended to represent a stock-specific or other investment recommendation, and our view of these holdings may change at any time based on stock price movements, new research conclusions, or changes in risk preference. Index information is included herein to show the general trend in the securities markets during the periods indicated and is not intended to imply that any referenced portfolio is similar to the indexes in either composition or volatility. Index returns are not an exact representation of any particular investment, as you cannot invest directly in an index.