U.S. Services:
Navigating Inflation’s Last Mile
- The start of 2024 has seen several hotter than expected inflation prints due largely to continued strength in the U.S. services sector.
- While the road to disinflation in services has been decidedly bumpy, we believe there are encouraging signs of softening ahead, particularly from the two largest contributors to services inflation today — shelter and motor vehicle insurance.
- Bessemer portfolios continue to focus on high quality companies, with the services sector being home to many nondiscretionary businesses that enjoy strong cash generation.
As the largest component of the U.S. economy, accounting for more than 80% of the value added to GDP, the services sector has long played a vital role in U.S. output, and it continues to be a key driver of economic growth today. Focus on the sector has recently intensified as it has been the primary — and, more recently, the only — contributor to several consecutive months of hotter than expected inflation this year. While this trend has raised questions about the path for continued progress of disinflation, we believe signs of relief are emerging. In this Investment Insights, we explore the importance of the services sector, current trends, including pre- and post-pandemic nuances, and the encouraging implications for economic growth, inflation, and monetary policy.
A Key Contributor to U.S. Economic Growth Today
The resilience of the U.S. economy in the past two years despite still elevated interest rates can largely be attributed to strength in the services sector.
Solid consumer spending was key to surprisingly strong economic growth in 2023, with services consumption outpacing goods consumption by more than two times.
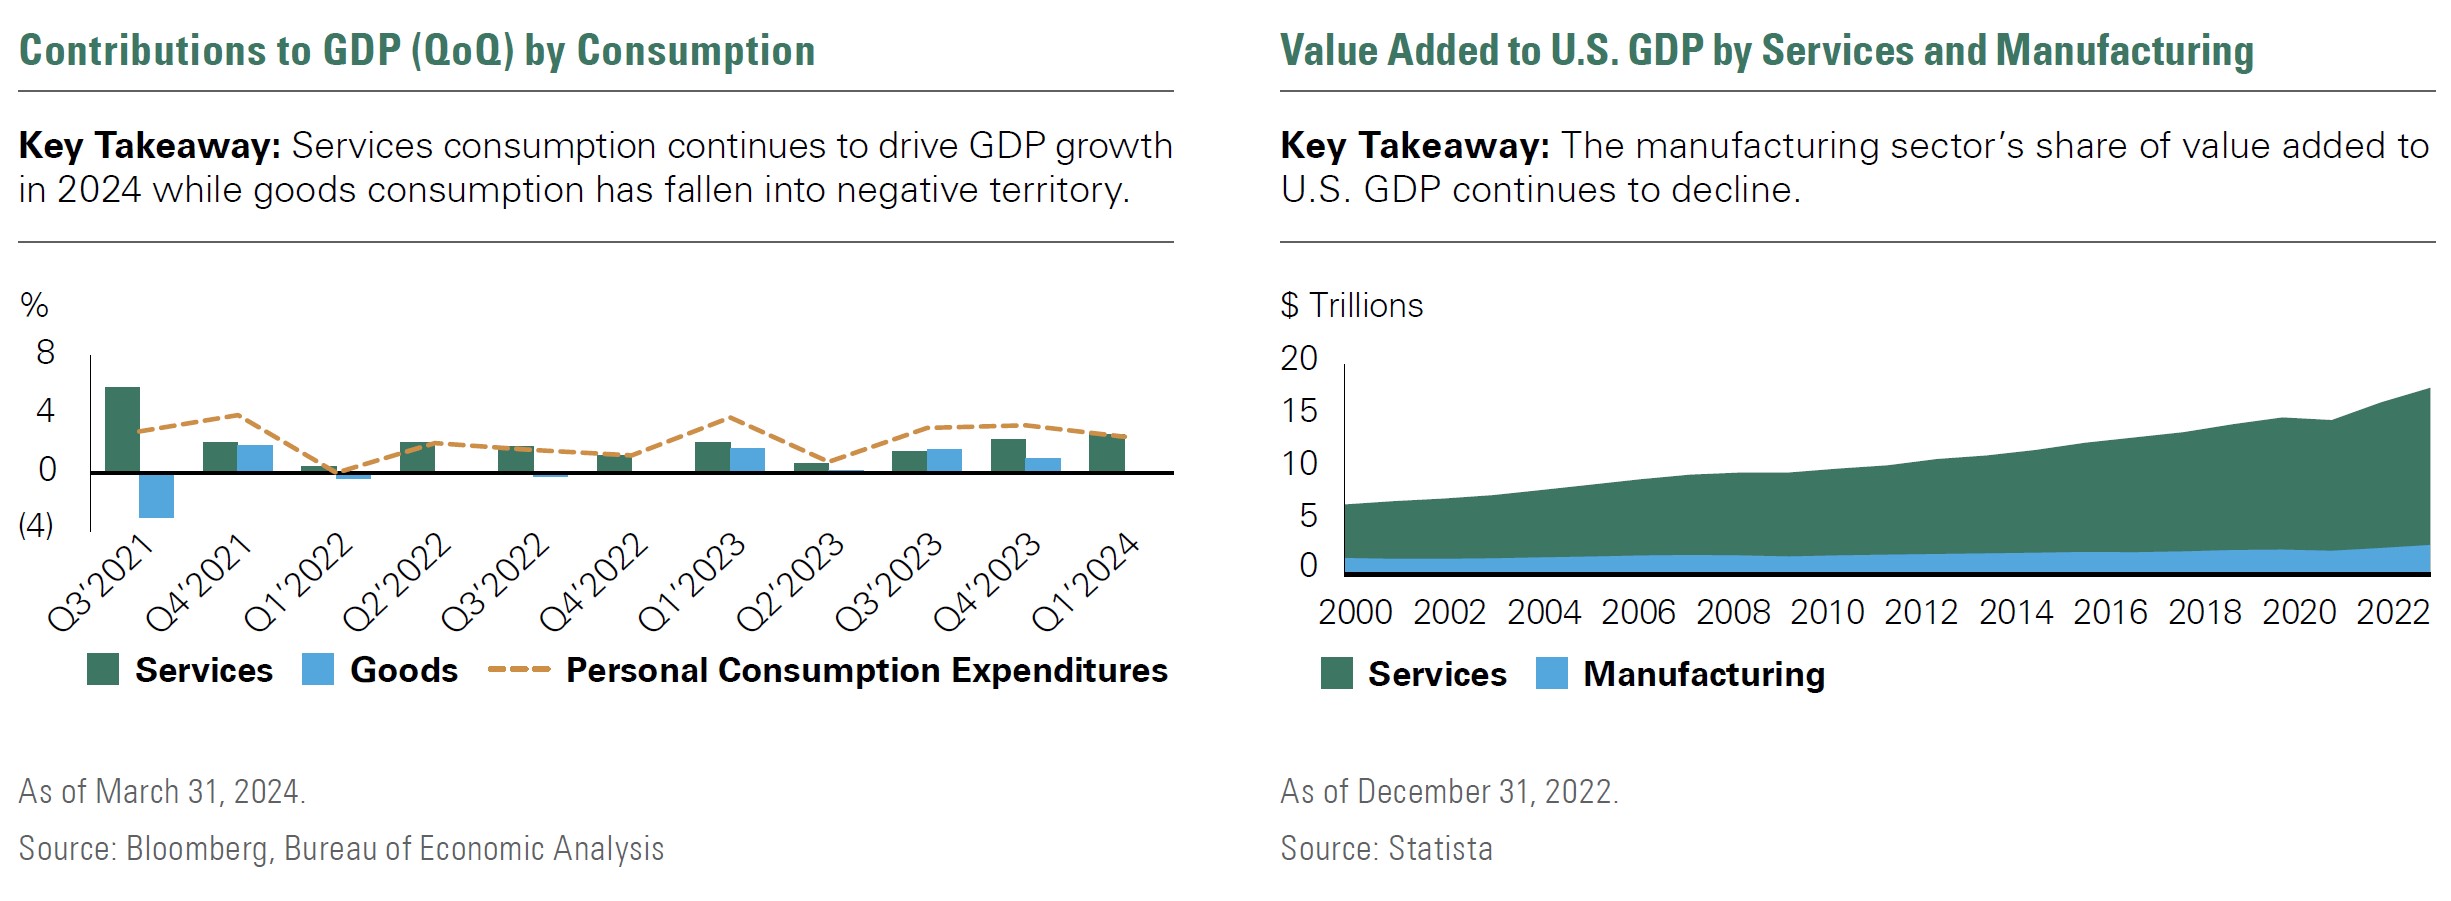
This trend has continued in 2024, with services consumption driving over 100% of GDP growth year-to-date, while the manufacturing sector’s share of value added to GDP relative to services continues to shrink (Exhibit 1). Growth in value added to GDP from services producing industries has been steady over the past two-plus decades, with the latest 2022 figure reaching nearly $18 trillion added from services.
Exhibit 1: Services Consumption is Driving Over 100% of GDP Growth, While the Manufacturing Sector’s Share of Value Added to GDP Relative to Services Continues to Shrink
Services Consumption is Driving Over 100% of GDP Growth, While the Manufacturing Sector’s Share of Value Added to GDP Relative to Services Continues to Shrink
The ISM Services PMI — a key leading indicator of services activity — further captures the overall strength of service-providing businesses, though some signs of slowing are emerging. The latest reading for April indicated a contraction in services, as the index dropped below 50 for the first time since December 2022. A reading above 50 indicates expansion in the services industry — as seen in 45 of the last 47 months. The most recent contraction could be a sign that the economy may be losing steam as higher interest rates slowly begin to impact service sector consumption.
While one data point doesn’t make a trend, this is a measure we will continue to track closely as we assess the growth and inflation picture in the U.S. economy. Some cooling of service sector demand would be supportive of continued disinflation and ultimately interest rates cuts. First quarter earnings results point to some weakness emerging, particularly for the low-income consumer, as evidenced by restaurants such as McDonald’s reporting sales declines.
Service-oriented businesses are also a critical driver of labor market strength, accounting for nearly 83% of jobs over the past decade and more recently supporting low unemployment, steady wage gains, and consumption. While consumers are modestly pulling back on spending so far this year, current levels are still supportive of a continued economic expansion.
It is also important to note that the pullback has been more centered on goods than services. Services spending continues to make up about two thirds of consumption, regardless of income level — that is, the lowest income quintile consumer is acquiring a similar share of services as the highest income quintile consumer. Looking ahead, given ongoing deterioration in consumer strength, we expect a disproportionate impact on goods demand versus services demand from an increasingly bifurcated consumer. We continue to monitor the consumer given its prominent role in shaping the U.S. economy.
History of the Services Sector
History of the Services Sector
Services consumption has consistently been the largest component of GDP for more than five decades. The goods sector, on the other hand, has historically seen swings in activity relative to services, with durable goods in particular contributing to volatility in consumer spending.
A reason for this difference is that even in times of recession, consumers continue to demand non-discretionary services such as healthcare and housing. Additionally, big ticket durable goods, such as vehicles, are typically purchased with credit or loans, which makes these areas of spending more interest-rate sensitive than services.
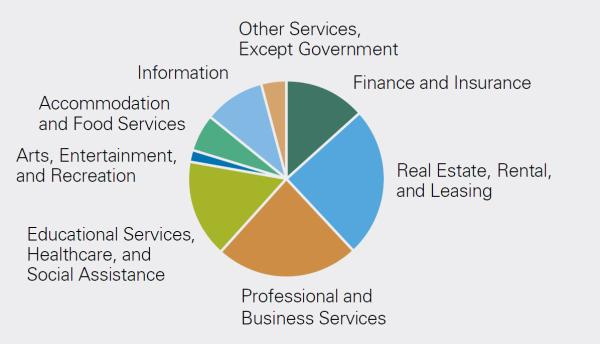
In the following pie chart, we break down the composition of value added to GDP by services-oriented industry, or each industry’s net contribution to overall economic output, for the most recent quarter. Key areas of contributions include vital industries such as professional and business services, real estate, finance, and healthcare.
Services Sector Value Added to GDP by Industry
Key Takeaway: The services sector includes many essential industries, such as healthcare, finance, and real estate.
As of March 28, 2024.
Source: Bureau of Labor Statistics
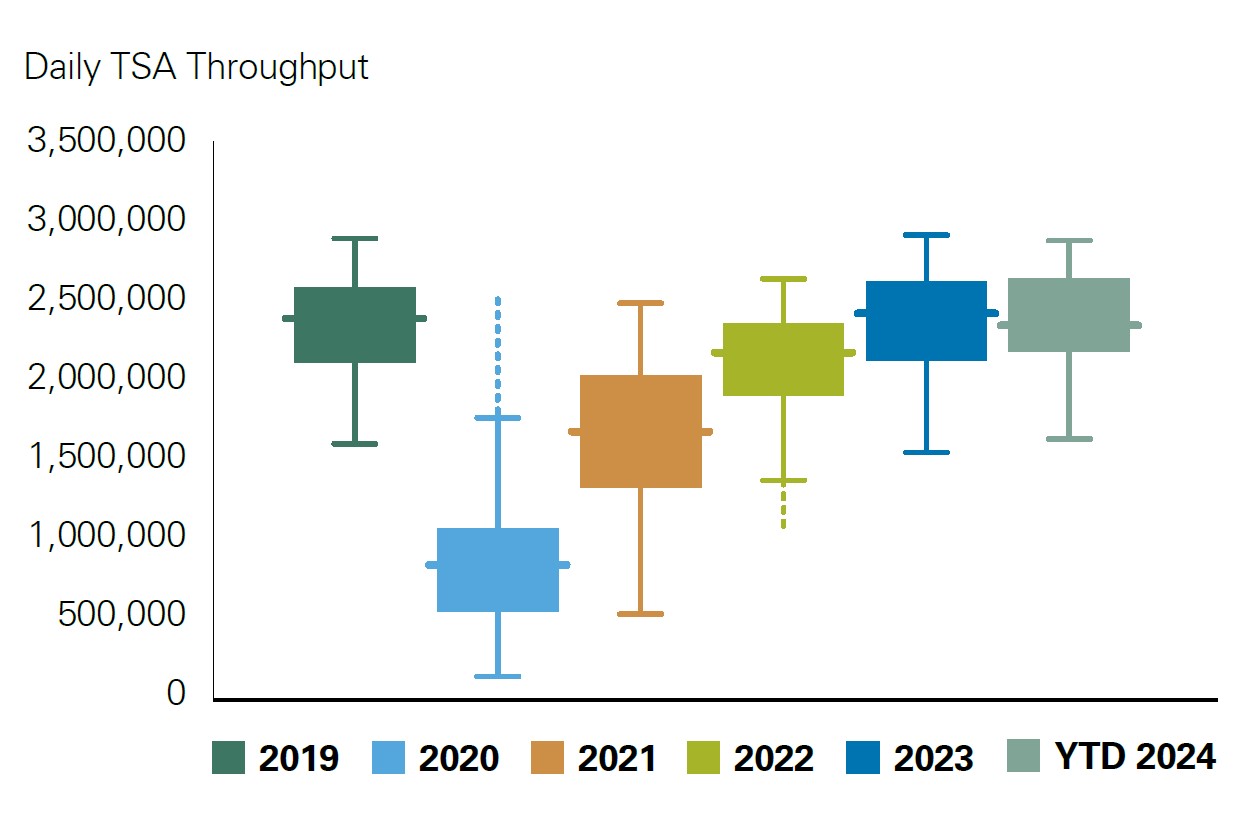
Further evidence of the services sector propelling growth can also be seen in travel and tourism, with travel data and consumer intentions to travel remaining strong. As measured by TSA passenger checkpoint volumes, travel so far in 2024 is back in line with pre-COVID levels of more than 2 million travelers per day, on average, after reaching a five-year low of 113k in April of 2020 (Exhibit 2). Slightly lower relative levels in 2024 compared to 2023 could reflect an easing of post-COVID pent-up demand, a loosening labor market, and higher airfares driven by the post-COVID boom in travel demand.
Exhibit 2: TSA Checkpoint Passenger Travel Volume
Key takeaway: TSA throughput volume is back in line with pre-COVID levels, reflecting a normalization in travel.
TSA throughput volume is back in line with pre-COVID levels, reflecting a normalization in travel.
Source: TSA
The Current Services Inflation Picture
Today, there are several one-offs in the services sector complicating the inflation story, with two key contributors driving headline and core CPI: shelter and motor vehicle insurance (Exhibit 3). Both measures of CPI have been higher than originally forecast to start 2024, and headline and core PCE — the Federal’s Reserve’s preferred inflation measure — have also been slightly higher than expected.
Exhibit 3: Contribution to Core Services CPI by Category
Key takeaway: Housing costs and motor vehicle insurance are driving most of remaining core services inflation.

Housing costs and motor vehicle insurance are driving most of remaining core services inflation.
Source: Bloomberg, Bureau of Labor Statistics
As we have noted in recent publications, the last mile of disinflation is typically the most challenging. Historically, services inflation has been tied to the strength of the labor market and, in turn, wages — a dynamic that has held during the current cycle. That said, the labor market has been normalizing, real wages are coming down, and signs of inflation relief are emerging with both April headline and core CPI in line with expectations, and year-over-year core CPI reaching its lowest rate since April 2021.
It is important to note that the two key contributors to remaining inflation today — shelter and motor vehicle insurance — are lagging indicators, with shelter lagging the market rate costs of housing and motor vehicle insurance premiums lagging car purchasing and servicing prices. The backward-looking nature of the two measures, therefore, does not indicate a reacceleration in inflation. This is a key nuance that we believe the Fed will consider when setting future policy.
While shelter makes up 35% of headline CPI, it only represents 18% of headline PCE, so if shelter costs remain stickier than we anticipate in the coming months, the Fed’s preferred inflation gauge is likely to be less impacted. Motor vehicle insurance, on the other hand, has a similar weight across the two inflation measures but is calculated differently, with PCE measuring the cost of auto insurance net of claims and CPI simply measuring prices paid by drivers. While motor vehicle insurance makes up approximately 3% of both headline and core CPI, it has meaningfully contributed to recent inflation due to the magnitude of price increases, which rose by an average of 23% year-over-year.
We discuss underlying dynamics and forward expectations for shelter and motor vehicle insurance below.
Shelter
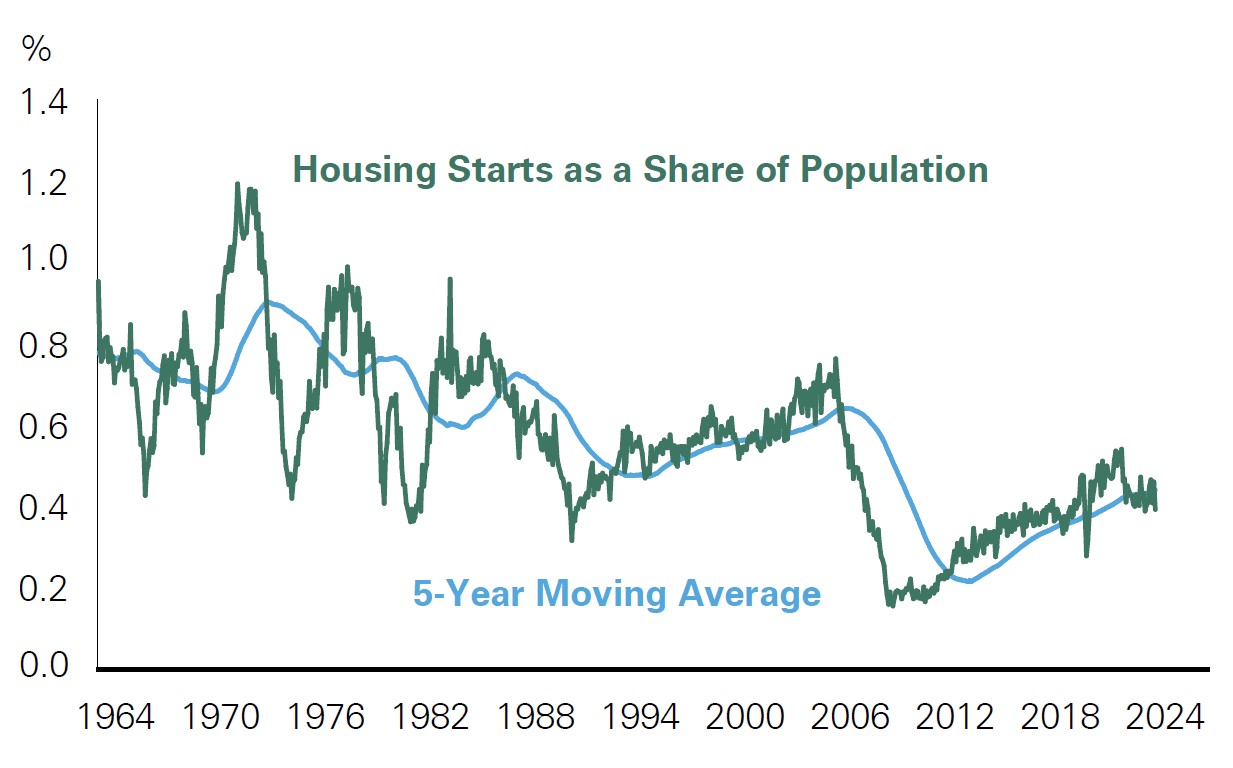
Elevated inflation seen in shelter — the largest remaining component of services inflation — largely reflects a combination of COVID-related spillovers and other structural dynamics in the housing market. COVID-induced demand for homes combined with strong wages, rising building costs, and other long-term supply constraints in the housing market have contributed to home price increases. Notably, the 2008 crisis brought new housing supply to a halt, resulting in housing production failing to keep pace with population growth (Exhibit 4) and in turn pressuring home prices.
Exhibit 4: Housing Starts as a Share of Population
Key takeaway: Housing production has not kept pace with population growth.
Housing production has not kept pace with population growth.
Source: Federal Reserve Economic Data
The supply of homes has been further constrained by the reluctance of homeowners who previously locked in low mortgage rates to sell in a still elevated interest rate environment, creating the perfect storm for record high prices. National home prices, as measured by the Case-Shiller Index, increased by nearly 20% from September 2020 to September 2021. Meanwhile, asking rent prices as measured by the Zillow Observed Rental Index (ZORI), fell during the pandemic but are now in line with their pre-pandemic trends.
The pandemic has not only altered preferences and caused supply chain disruptions, but it also exacerbated underlying supply-related constraints in the housing market that have been progressing for decades. This combination ultimately resulted in a reduction in the stock of available homes.
The pressure on shelter prices has largely been driven by Owner’s Equivalent Rent (OER), or the Bureau of Labor Statistics’ (BLS) estimate of the rental equivalent price of an owned property. As a lagging indicator, OER is currently reflecting past high market rate costs of housing.
We must also consider other nuances related to OER. For example, the OER metric was reweighted by the BLS in January of last year, resulting in a notably higher weight for single-family detached homes. Given stronger relative rent increases for single-family versus multi-family housing, the reweighting has modestly supported subsequent OER figures in 2024 and therefore slowed progress toward overall shelter disinflation. Other factors that are difficult to capture have also contributed to upward pressure on OER, such as immigration-led demand for housing.
Looking ahead, key leading indicators are currently pointing to expected relief for OER and, in turn, shelter (Exhibit 5). We expect a deceleration in shelter and services prices to contribute to a sustained move lower in inflation.
Exhibit 5: Shelter Inflation Against Rent-Based Leading Indicators
Key takeaway: Real time indicators point to a likely deceleration in shelter and services prices.

Real time indicators point to a likely deceleration in shelter and services prices.
Source: Bloomberg, Bureau of Economic Analysis, Bureau of Labor Statistics
Motor Vehicle Insurance
The spike in motor vehicle insurance premiums is, similar to shelter, largely a lagged effect of pandemic-related disruptions in the motor vehicle and related sectors that continue to unwind today. Pandemic-led semiconductor shortages constrained new vehicle production — which fell from a pre-pandemic average of 11.7 million to less than 9 million in the fall of 2021 — and resulted in buyers flooding the used car markets and in turn creating record price increases of 45% year-over-year at the peak.
The combination of strong demand and supply chain bottlenecks also led to price pressures in the new vehicle market. In turn, motor vehicle parts, maintenance, and insurance inflation, respectively, followed suit. The overall goods-related inflation and disinflation has come in waves. And while the above trends are primarily related to the goods sector, we are seeing spillover into the services component with the rise of motor vehicle insurance premiums being the latest notable surfacing, though dwindling, undercurrent (Exhibit 6).
Exhibit 6: 12-Month % Change in CPI by Category
Key takeaway: COVID-induced disruptions in the motor vehicle and related sectors continue to unwind.
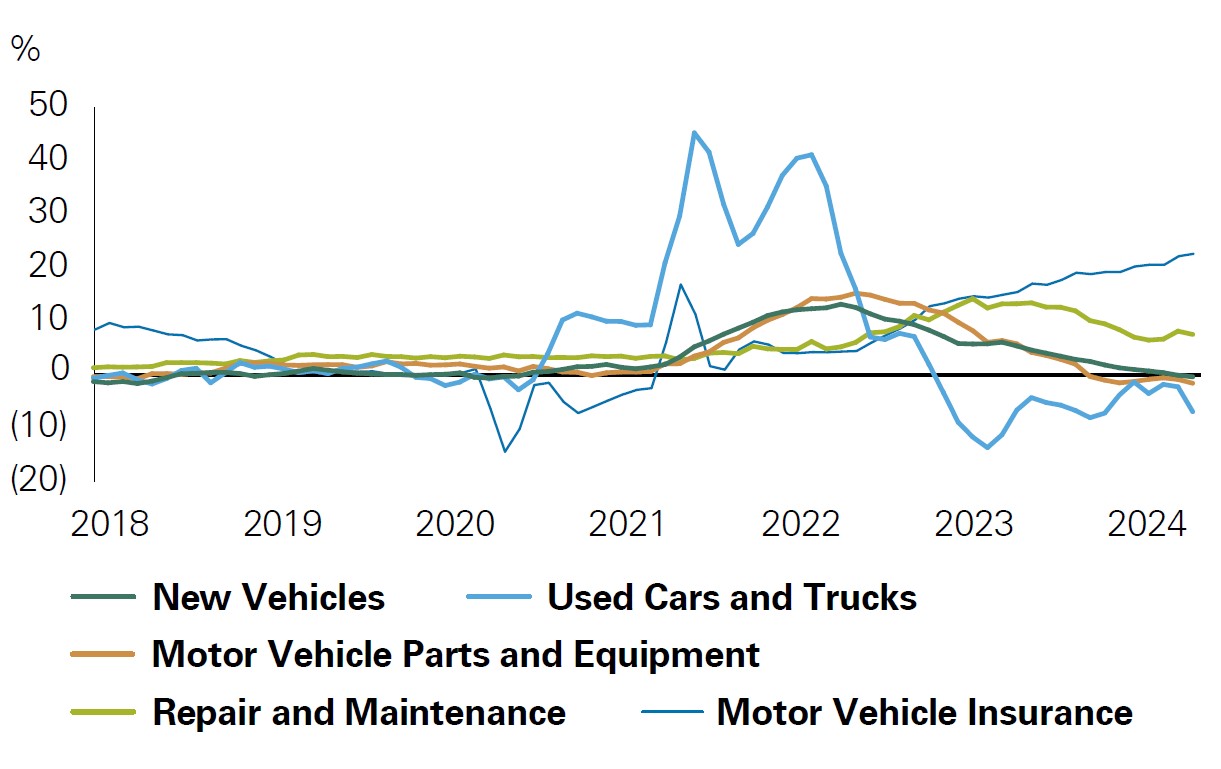
COVID-induced disruptions in the motor vehicle and related sectors continue to unwind.
Source: Bloomberg, Bureau of Labor Statistics
Other seasonal factors, such as annual insurance-premium increases implemented in January, have also impacted recent data. Moreover, the motor vehicle insurance space is rife with competition.
As a result of these dynamics, we expect inflation pressure from insurance premiums to subside as the year progresses. Additionally, given the lagged nature of the inflation seen in motor vehicle insurance, leading indicators such as new and used vehicle prices and repair and maintenance costs point to expected relief.
It is important to note the key driver of inflation in the last few years: money supply growth largely driven by pandemic-related fiscal stimulus. Peaking at 26.8% year-over-year at the start of 2021, money supply growth has led to the run up in inflation. Now, it sits at -0.3% year-over-year, another indicator that further easing in inflationary pressures is underway. Considering the combination of the various inflation drivers, we believe today’s inflation dynamics are not reflecting issues that would reignite an overheating economy, but rather lagging indicators catching up to trend. Looking ahead, we expect a deceleration in overall services to help move inflation toward the Fed’s target.
Portfolio Positioning
Bessemer portfolios continue to focus on high quality businesses with strong cash generation.
Public Investments
Within public investments, portfolios have exposure to companies in the services economy within sectors such as financials, healthcare, and consumer staples. With the services sector being home to many nondiscretionary businesses, Bessemer portfolios have benefited from tailwinds such as rising insurance premiums and a continued increase in drug trials.
A resilient consumer is another theme seen across portfolios, with travel booking platforms such as Booking Holdings Inc. benefiting from a resumption of travel in line with pre-COVID levels. Its first quarter 2024 earnings report further confirmed this trend, with the company noting that there are no signs of weakness in consumer travel demand or trading down in terms of length of stays and quality of lodgings booked.
Private Investments
Within private investments, Bessemer portfolios focus on three key themes within the services economy.
The first theme is essential consumer services, an area of strength given its growing, nondiscretionary end markets. Within this area, portfolios are focused on highly fragmented segments including animal health services, automotive services, and residential services. For example, within general maintenance and tire services — the largest segment within auto services — a Moorpark, California-based portfolio company has benefited from its superior technology infrastructure, allowing for rapid and accretive consolidation at scale.
The second theme, niche industrial services, is an area with an abundance of businesses operating critical but often overlooked services that are less susceptible to disruption. Portfolio companies focus on segments such as crane inspection and repair and diversified aviation servicing. Within aviation, the team believes rising global passenger revenue miles is a secular trend, in line with the team’s focus on services-oriented companies that have the ability to grow at a faster pace than GDP.
A Sugarland, Texas-based portfolio company that focuses on critical aircraft services such as refueling and de-icing has been able to outpace GDP growth consistently due to its market position and outsourcing trends among airlines.
The final key theme is business services, which is a focus for the investment team given the sector’s wide variety of idiosyncratic business models and value-based pricing dynamics. Underlying portfolio companies focus on services such as interstate interchange and bridge design, occupational health testing and medical exams, and frozen food distribution. A recent example includes a Kansas City-based company providing OSHA-mandated audiograms for over 3,000 clients operating in high-noise workplace environments.
Conclusion
As we look ahead, the inflation and growth trajectories are two areas we continue to monitor in the U.S. economy. Several soft recent economic data releases reflect the slowing in growth that we expected given a multitude of factors including the impact of higher interest rates permeating the economy, dwindling excess consumer savings, and a decline in real wage growth. We continue to monitor such trends as they further complicate the interest rate easing backdrop.
While the road to disinflation in the services component has remained bumpy, we believe there are encouraging signs. Currently, 20% of headline CPI components are in deflationary territory, and only a handful of subcategories are experiencing accelerating inflation — including shelter and motor vehicle insurance. While inflation in the shelter component has been sticky, real-time indicators point to signs of softening ahead. Motor vehicle insurance remains a small portion of CPI, likely to result in relief once the magnitude of increases softens. Moreover, it is important to note that money supply growth, the main inflation driver, is in negative territory and therefore likely to further ease inflation. Other macroeconomic dynamics — such as a normalizing labor market and resultant pressure reduction on wages — remain pivotal to long term inflation dynamics and can contribute to further easing for overall inflation measures.
Past performance is no guarantee of future results. This material is provided for your general information. It does not take into account the particular investment objectives, financial situations, or needs of individual clients. This material has been prepared based on information that Bessemer Trust believes to be reliable, but Bessemer makes no representation or warranty with respect to the accuracy or completeness of such information. This presentation does not include a complete description of any portfolio mentioned herein and is not an offer to sell any securities. Investors should carefully consider the investment objectives, risks, charges, and expenses of each fund or portfolio before investing. Views expressed herein are current only as of the date indicated, and are subject to change without notice. Forecasts may not be realized due to a variety of factors, including changes in economic growth, corporate profitability, geopolitical conditions, and inflation. The mention of a particular security is not intended to represent a stock-specific or other investment recommendation, and our view of these holdings may change at any time based on stock price movements, new research conclusions, or changes in risk preference. Index information is included herein to show the general trend in the securities markets during the periods indicated and is not intended to imply that any referenced portfolio is similar to the indexes in either composition or volatility. Index returns are not an exact representation of any particular investment, as you cannot invest directly in an index. Alternative (private) investments, including private equity, real assets and hedge funds, are not suitable for all clients and are available only to qualified investors.
