Housing Market Update in Five Pictures:
Why This Cycle Is Different
The U.S. housing market has presented a paradox over the last two years. Traditional supply and demand dynamics appear disrupted. Despite elevated mortgage rates leading to record low affordability and diminished housing demand, home prices reached new highs in June.
The housing sector’s unusual strength underscores the complexities facing policymakers as they navigate the post-pandemic economic landscape.
Unique to this cycle is the interest rate “lock-in effect” — that is, when homeowners with relatively low fixed rate mortgages are reluctant to relinquish them for new loans at higher rates. This dynamic has simultaneously constrained housing supply, preserved many households’ purchasing power, and increased their store of wealth given the rise in home prices.
Elevated mortgage rates are also amplifying a bifurcation between the high-end and lower-end consumer, a dichotomy that is likely, in Bessemer’s view, to encourage the Federal Reserve to cut rates sooner at the next meeting. In this update, we outline the dynamics that have led to the current housing backdrop and our forward expectations given leading indicators.
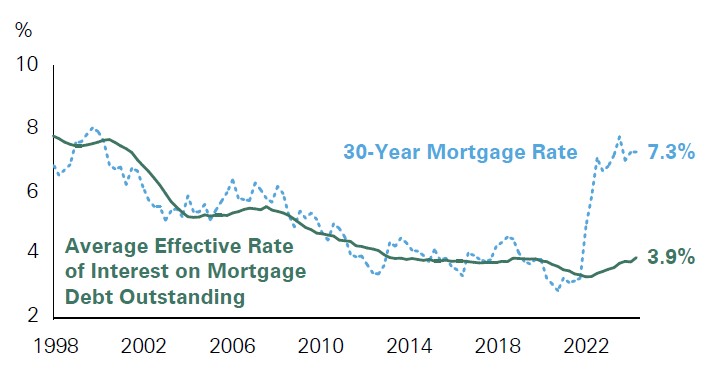
Exhibit 1: Average Rates on All Outstanding Mortgages vs. Current 30-Year Mortgage Rate
Key Takeaway: The interest rate “lock-in” effect has led to a lower average mortgage rate outstanding than the current 30-year rate.
This cycle is different. Despite mortgage rates having risen to over 7% during the past 18 months, the average rate on all outstanding mortgages is only 3.9% as many homeowners locked in low interest rates around the time of the pandemic. This disparity has created a unique economic landscape and helps explain why the American consumer has weathered the storm of high interest rates with greater resilience than their counterparts in other countries, which tend to have variable mortgage rates.
Source: Bankrate.com, Bloomberg, Bureau of Economic Analysis
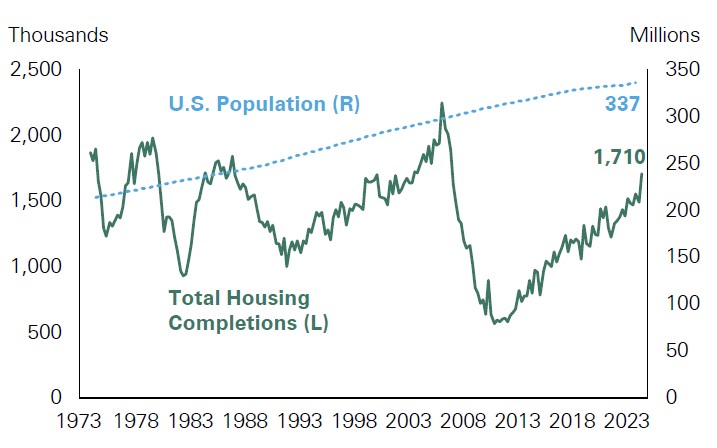
Exhibit 2: U.S. Dwellings Completion and Population Growth
Key Takeaway: There is a structural shortage of U.S. homes as new construction has failed to keep pace with population growth.
Since the Global Financial Crisis, new home construction in the U.S. has not kept pace with population growth, leading to a structural undersupply of housing. To bring home construction back in line with historical averages, it is estimated that the U.S. would need to add an additional 1.5 million new homes.
Source: Bloomberg, Federal Reserve Economic Database, U.S. Census Bureau
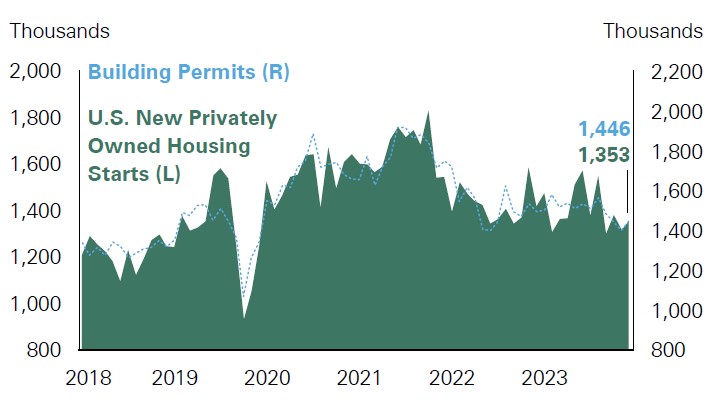
Exhibit 3: U.S. Privately Owned New Housing Starts and Building Permits
Key Takeaway: New and planned home construction are at their lowest levels in four years.
Housing starts and building permits, which can be leading indicators for future construction, have fallen to levels not seen since the pandemic-led shutdowns and are evidence of low home affordability and/or builder expectations for a continuation of the interest rate lock-in effect in the near future. Reduced construction employment will be a headwind for the economy at a time that consumer spending is also slowing. Construction levels are unlikely to pick up until affordability improves and mortgage rates meaningfully decline.
Source: Bloomberg, U.S. Census Bureau
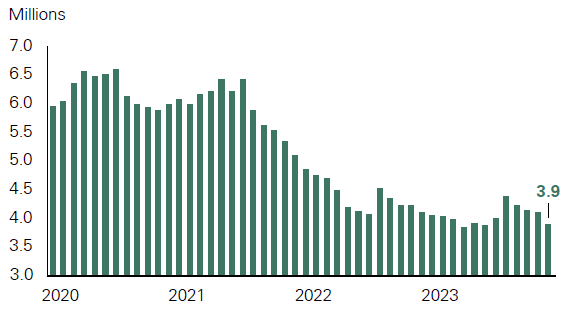
Exhibit 4: U.S. Existing Home Sales
Key Takeaway: Existing home sales are close to record lows given the interest rate “lock-in” effect.
Record-low affordability driven by higher home prices and high mortgage rates has caused existing home sales to slump to multidecade lows. The interest lock-in effect has amplified the trend as homeowners with low mortgage rates are reluctant to sell and incur higher rates.
Source: Bloomberg, National Association of Realtors
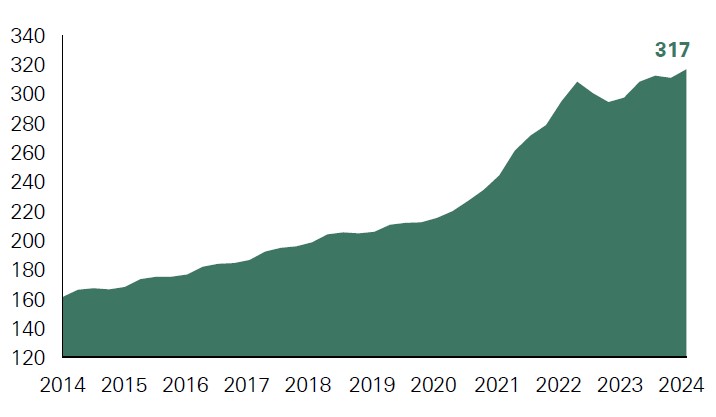
Exhibit 5: Case-Shiller National Home Price Index
Key Takeaway: Nationwide home prices are at record highs.
Low inventory levels, driven by elevated mortgage rates and a lack of new supply, are pushing home prices higher. U.S. national house prices, having fallen a little in late 2022, have moved higher since, rising 5.9% in May from the year before and hitting a new all-time high. The index is 50% above 2019 levels.
Source: Bloomberg, National Association of Realtors
Conclusion
Looking ahead, Bessemer expects housing activity to continue facing headwinds from historically high mortgage rates, affordability issues, and supply constraints. Lower interest rates should provide some relief. Amid these supply side challenges, we expect overall demand for housing to stay strong given pent-up demand, a gap in housing supply relative to population, and favorable demographics, suggesting prices will likely continue to rise, albeit at a slower pace than in recent years.
Past performance is no guarantee of future results. This material is provided for your general information. It does not take into account the particular investment objectives, financial situations, or needs of individual clients. This material has been prepared based on information that Bessemer Trust believes to be reliable, but Bessemer makes no representation or warranty with respect to the accuracy or completeness of such information. This presentation does not include a complete description of any portfolio mentioned herein and is not an offer to sell any securities. Investors should carefully consider the investment objectives, risks, charges, and expenses of each fund or portfolio before investing. Views expressed herein are current only as of the date indicated, and are subject to change without notice. Forecasts may not be realized due to a variety of factors, including changes in economic growth, corporate profitability, geopolitical conditions, and inflation. The mention of a particular security is not intended to represent a stock-specific or other investment recommendation, and our view of these holdings may change at any time based on stock price movements, new research conclusions, or changes in risk preference. Index information is included herein to show the general trend in the securities markets during the periods indicated and is not intended to imply that any referenced portfolio is similar to the indexes in either composition or volatility. Index returns are not an exact representation of any particular investment, as you cannot invest directly in an index.