Consumer Update in Five Pictures
Despite recent declines in consumer confidence due to policy uncertainty, U.S. consumers overall continue to display resilience bolstered by a healthy labor market and wealth effects; however, bifurcation between high- and low-income cohorts remains pronounced. High-income consumers have benefited from substantial increases in asset prices and home values, while low-income consumers have struggled with the effects of high inflation and interest rates.
Labor market conditions, and therefore wages and income levels, are the primary driver of consumers’ willingness and ability to spend, as job stability and earnings significantly influence purchasing power and sentiment. Overall, the labor market remains on solid footing with stable job growth and relatively low unemployment supporting consumption and driving economic growth.
Higher-income cohorts experience greater benefits from wealth effects, partly due to their significant ownership of stocks. As individuals become wealthier, their marginal propensity to consume increases. Strong returns from the S&P 500 over the past two years have helped propel this effect.
While lower-income consumers continue to feel financial pressure, further progress on inflation and lower rates should provide some relief. In this Investment Insights, we provide an update on current consumer dynamics, including details on the state of the labor market, consumers, and expectations for economic growth.
Exhibit 1: Change in Nonfarm Payrolls
Key Takeaway: Labor market indicators continue to signal resilience with month-over-month nonfarm payroll jobs growth trending above its long-term average.
Job growth is a key driver of consumption. Despite some adverse weather-related volatility this year, overall job growth in recent months has proved stronger than anticipated. In 2024, the U.S. economy added an average of 166,000 jobs per month, above the 20-year average of about 110,000 per month. This robust job growth is indicative of a resilient labor market, which should support continued consumer spending and overall economic expansion this year.
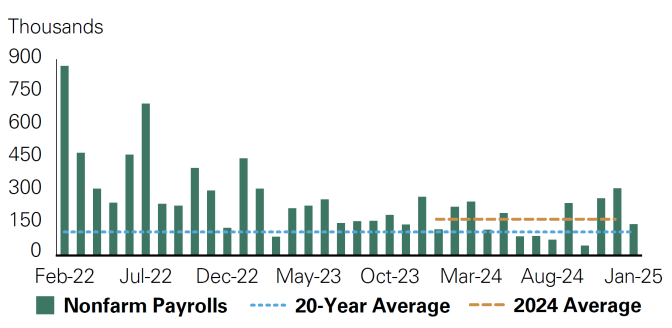
Source: Bloomberg
Exhibit 2: Wage and Price Level Growth
Key Takeaway: Wages are growing faster than inflation, a trend that has been key to supporting consumption.
Wages have caught up to prices and have surpassed increases in price levels. During the pandemic, prices outpaced wages, eroding consumers’ purchasing power. High levels of employment have helped sustain steady wage growth, while inflation has gradually eased since 2022. This divergence has led to real wage gains, supporting overall consumer spending.
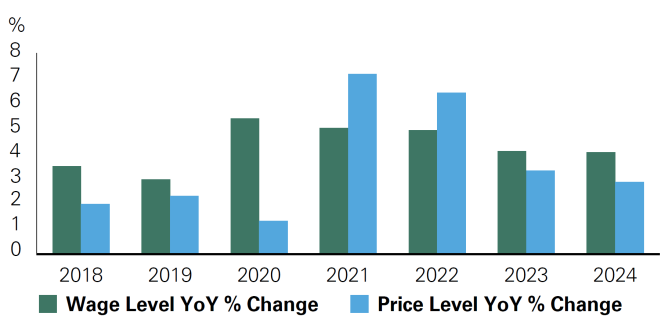
Wages = average hourly earnings; prices = CPI. Wages and prices indexed to 100 in 2019. Source: Bloomberg
Exhibit 3: Assets by Wealth Percentile Group
Key Takeaway: Higher-income consumers have more exposure to the stock market, resulting in disproportionate wealth effects across income cohorts.
Wealth effects — the concept that as households become wealthier, they tend to spend more — also supported consumption last year. This dynamic was particularly pronounced in 2024 as the S&P 500 finished the year with its second consecutive 20%+ annual gain. Strong performance in the stock market, especially for wealthier households with substantial equity holdings, likely boosted spending levels for high-income cohorts.
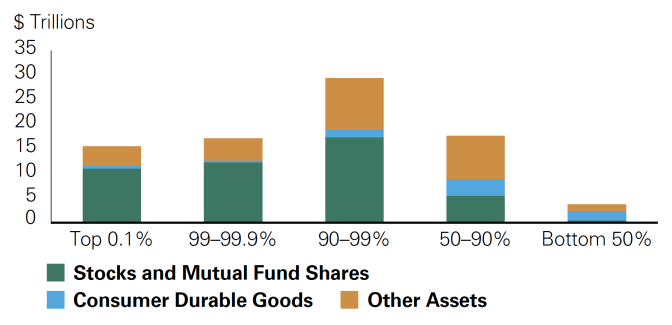
Source: Federal Reserve
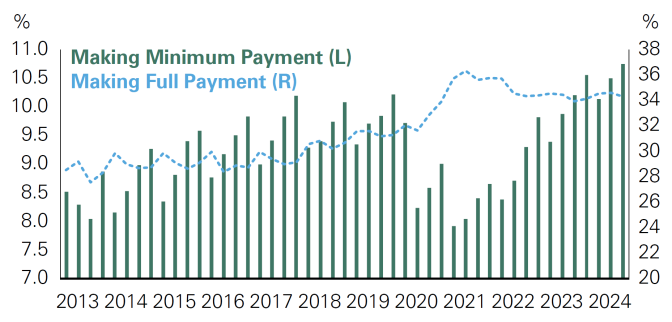
Exhibit 4: Share of Consumers Making Full Credit Card Payments Versus Share Making Minimum Payments
Key Takeaway: The percentage of consumers making either full or minimum payments on their credit cards is elevated.
Consumer balance sheets are generally healthy, and while the percentage of consumers making only the minimum payments on their credit cards is at a 10-year high, the percentage of those making the full payment is also near a 10-year high.
Bessemer portfolios have exposure to companies that benefit from consumers searching for inexpensive alternatives. For example, BJ’s Wholesale Club, a lower-cost retail store, has seen its membership base grow as inflation has drawn interest to its low prices.
Source: Federal Reserve Bank of Philadelphia
Exhibit 5: Contribution to Personal Consumption Expenditure by Income Quintile
Key Takeaway: Higher-income consumers drive a disproportionately large share of total consumption, making their behavior key to overall spending trends.
Consumers in the top two highest-earning quintiles drive about 61% of total personal consumption, underscoring their critical role in economic activity. Despite making up a smaller portion of the population, their spending power reflects higher disposable incomes and the costs associated with their consumption patterns. Bessemer portfolios are positioned to benefit from this trend, with exposure to companies that cater to high-end consumer spending, such as leisure travel. Strong fourth-quarter earnings from Booking Holdings, a Bessemer holding and leading online travel company, further signal robust global demand in this space.
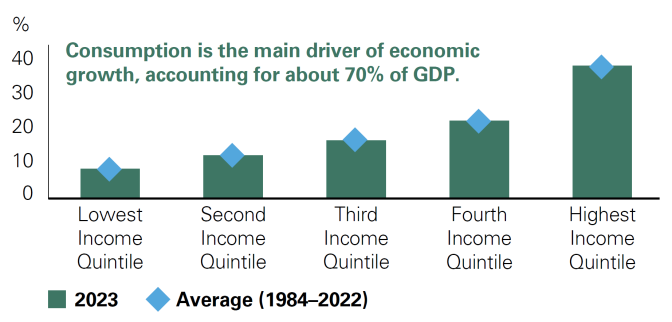
Source: Bureau of Labor Statistics
Conclusion
Looking ahead, the trajectory of the U.S. economy this year will largely depend on consumer resilience. We believe stable job growth and low unemployment will support overall consumption, while easing inflation and additional rate cuts should provide relief for lower-income households.
We remain mindful of the risk that persistent inflation and delayed rate cuts could weaken consumer confidence and impact spending. However, despite some uncertainty, household balance sheets remain generally strong, with wage growth continuing to outpace inflation.
Amid this backdrop, we expect sustained consumer strength this year, supporting ongoing economic growth. Bessemer portfolios are positioned to capitalize on consumer bifurcation trends, identifying high-quality companies that we believe can benefit from spending patterns across consumer cohorts and navigate downside risks.
Past performance is no guarantee of future results. This material is provided for your general information. It does not take into account the particular investment objectives, financial situations, or needs of individual clients. This material has been prepared based on information that Bessemer Trust believes to be reliable, but Bessemer makes no representation or warranty with respect to the accuracy or completeness of such information. This presentation does not include a complete description of any portfolio mentioned herein and is not an offer to sell any securities. Views expressed herein are current only as of the date indicated, and are subject to change without notice. Forecasts may not be realized due to a variety of factors, including changes in economic growth, corporate profitability, geopolitical conditions, and inflation. The mention of a particular security is not intended to represent a stock-specific or other investment recommendation, and our view of these holdings may change at any time based on stock price movements, new research conclusions, or changes in risk preference. Index information is included herein to show the general trend in the securities markets during the periods indicated and is not intended to imply that any referenced portfolio is similar to the indexes in either composition or volatility. Index returns are not an exact representation of any particular investment, as you cannot invest directly in an index.